Mongolian vs Japanese 11th Grade
COMPARE
Mongolian
Japanese
11th Grade
11th Grade Comparison
Mongolians
Japanese
93.0%
11TH GRADE
87.6/ 100
METRIC RATING
133rd/ 347
METRIC RANK
89.9%
11TH GRADE
0.0/ 100
METRIC RATING
299th/ 347
METRIC RANK
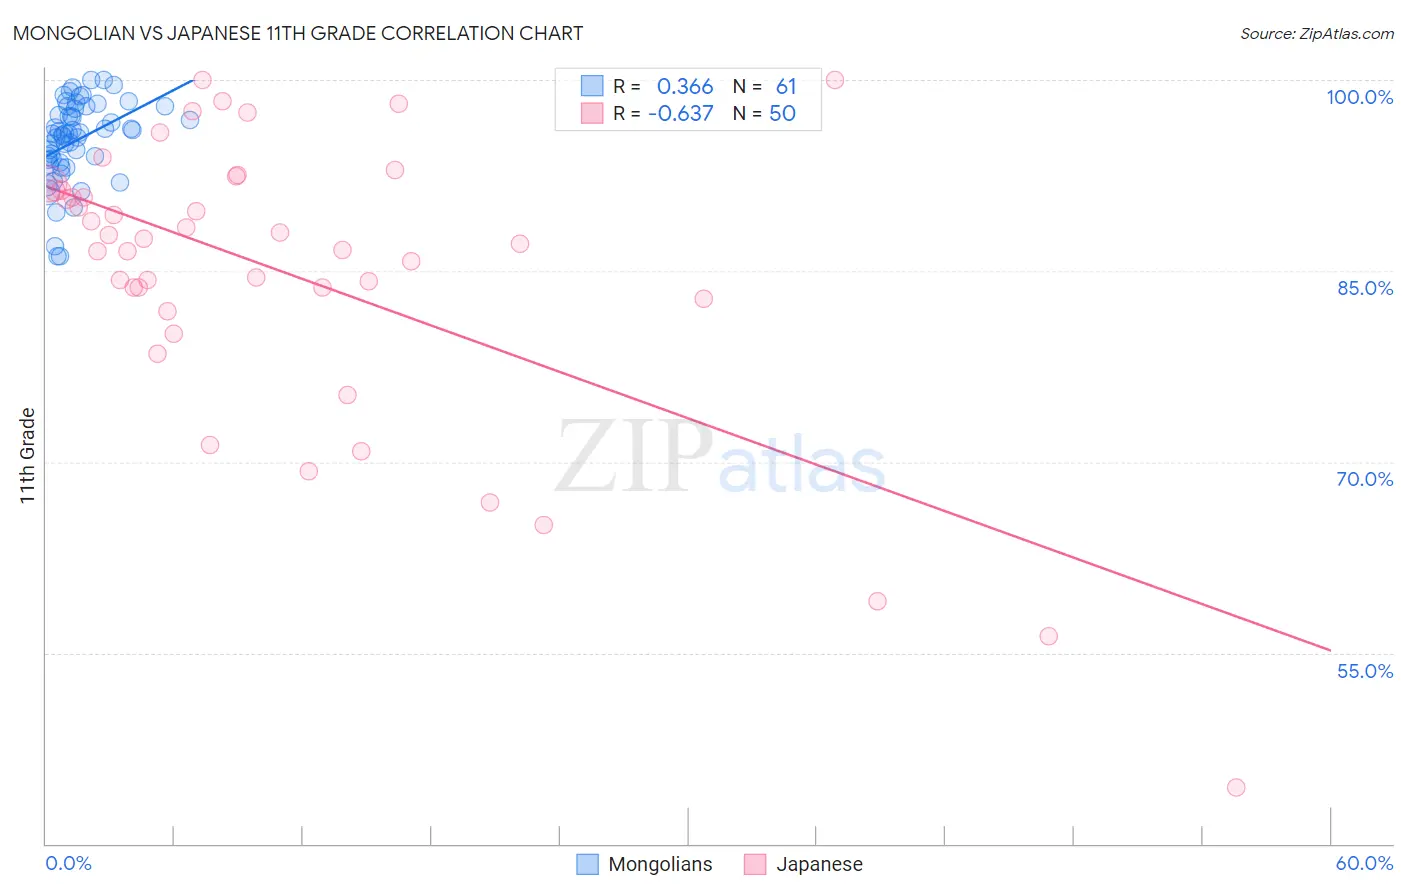
Mongolian vs Japanese 11th Grade Correlation Chart
The statistical analysis conducted on geographies consisting of 140,362,004 people shows a mild positive correlation between the proportion of Mongolians and percentage of population with at least 11th grade education in the United States with a correlation coefficient (R) of 0.366 and weighted average of 93.0%. Similarly, the statistical analysis conducted on geographies consisting of 249,183,224 people shows a significant negative correlation between the proportion of Japanese and percentage of population with at least 11th grade education in the United States with a correlation coefficient (R) of -0.637 and weighted average of 89.9%, a difference of 3.4%.
11th Grade Correlation Summary
| Measurement | Mongolian | Japanese |
| Minimum | 86.1% | 44.4% |
| Maximum | 100.0% | 100.0% |
| Range | 13.9% | 55.6% |
| Mean | 95.2% | 84.8% |
| Median | 95.8% | 87.3% |
| Interquartile 25% (IQ1) | 93.6% | 82.8% |
| Interquartile 75% (IQ3) | 97.8% | 91.4% |
| Interquartile Range (IQR) | 4.2% | 8.6% |
| Standard Deviation (Sample) | 3.2% | 11.5% |
| Standard Deviation (Population) | 3.2% | 11.4% |
Similar Demographics by 11th Grade
Demographics Similar to Mongolians by 11th Grade
In terms of 11th grade, the demographic groups most similar to Mongolians are Delaware (93.0%, a difference of 0.010%), Immigrants from Italy (92.9%, a difference of 0.020%), Immigrants from Bosnia and Herzegovina (93.0%, a difference of 0.030%), Cree (92.9%, a difference of 0.030%), and Arab (92.9%, a difference of 0.040%).
| Demographics | Rating | Rank | 11th Grade |
| Basques | 95.2 /100 | #126 | Exceptional 93.2% |
| Immigrants | Kazakhstan | 92.4 /100 | #127 | Exceptional 93.1% |
| Immigrants | Jordan | 92.4 /100 | #128 | Exceptional 93.1% |
| Immigrants | Ukraine | 89.8 /100 | #129 | Excellent 93.0% |
| Albanians | 89.5 /100 | #130 | Excellent 93.0% |
| Egyptians | 89.5 /100 | #131 | Excellent 93.0% |
| Immigrants | Bosnia and Herzegovina | 89.0 /100 | #132 | Excellent 93.0% |
| Mongolians | 87.6 /100 | #133 | Excellent 93.0% |
| Delaware | 87.3 /100 | #134 | Excellent 93.0% |
| Immigrants | Italy | 86.6 /100 | #135 | Excellent 92.9% |
| Cree | 85.9 /100 | #136 | Excellent 92.9% |
| Arabs | 85.4 /100 | #137 | Excellent 92.9% |
| Immigrants | Brazil | 85.1 /100 | #138 | Excellent 92.9% |
| Crow | 84.1 /100 | #139 | Excellent 92.9% |
| Venezuelans | 83.4 /100 | #140 | Excellent 92.9% |
Demographics Similar to Japanese by 11th Grade
In terms of 11th grade, the demographic groups most similar to Japanese are Immigrants from Haiti (89.9%, a difference of 0.010%), Guyanese (89.9%, a difference of 0.020%), Immigrants from Fiji (89.9%, a difference of 0.030%), Navajo (90.0%, a difference of 0.10%), and Fijian (90.0%, a difference of 0.14%).
| Demographics | Rating | Rank | 11th Grade |
| Cubans | 0.0 /100 | #292 | Tragic 90.2% |
| Natives/Alaskans | 0.0 /100 | #293 | Tragic 90.2% |
| Immigrants | Grenada | 0.0 /100 | #294 | Tragic 90.1% |
| Immigrants | Vietnam | 0.0 /100 | #295 | Tragic 90.0% |
| Fijians | 0.0 /100 | #296 | Tragic 90.0% |
| Navajo | 0.0 /100 | #297 | Tragic 90.0% |
| Immigrants | Fiji | 0.0 /100 | #298 | Tragic 89.9% |
| Japanese | 0.0 /100 | #299 | Tragic 89.9% |
| Immigrants | Haiti | 0.0 /100 | #300 | Tragic 89.9% |
| Guyanese | 0.0 /100 | #301 | Tragic 89.9% |
| Immigrants | Guyana | 0.0 /100 | #302 | Tragic 89.7% |
| Immigrants | Immigrants | 0.0 /100 | #303 | Tragic 89.7% |
| Yuman | 0.0 /100 | #304 | Tragic 89.7% |
| Immigrants | Cambodia | 0.0 /100 | #305 | Tragic 89.6% |
| Ecuadorians | 0.0 /100 | #306 | Tragic 89.6% |