Mongolian vs Immigrants from El Salvador 11th Grade
COMPARE
Mongolian
Immigrants from El Salvador
11th Grade
11th Grade Comparison
Mongolians
Immigrants from El Salvador
93.0%
11TH GRADE
87.6/ 100
METRIC RATING
133rd/ 347
METRIC RANK
85.3%
11TH GRADE
0.0/ 100
METRIC RATING
343rd/ 347
METRIC RANK
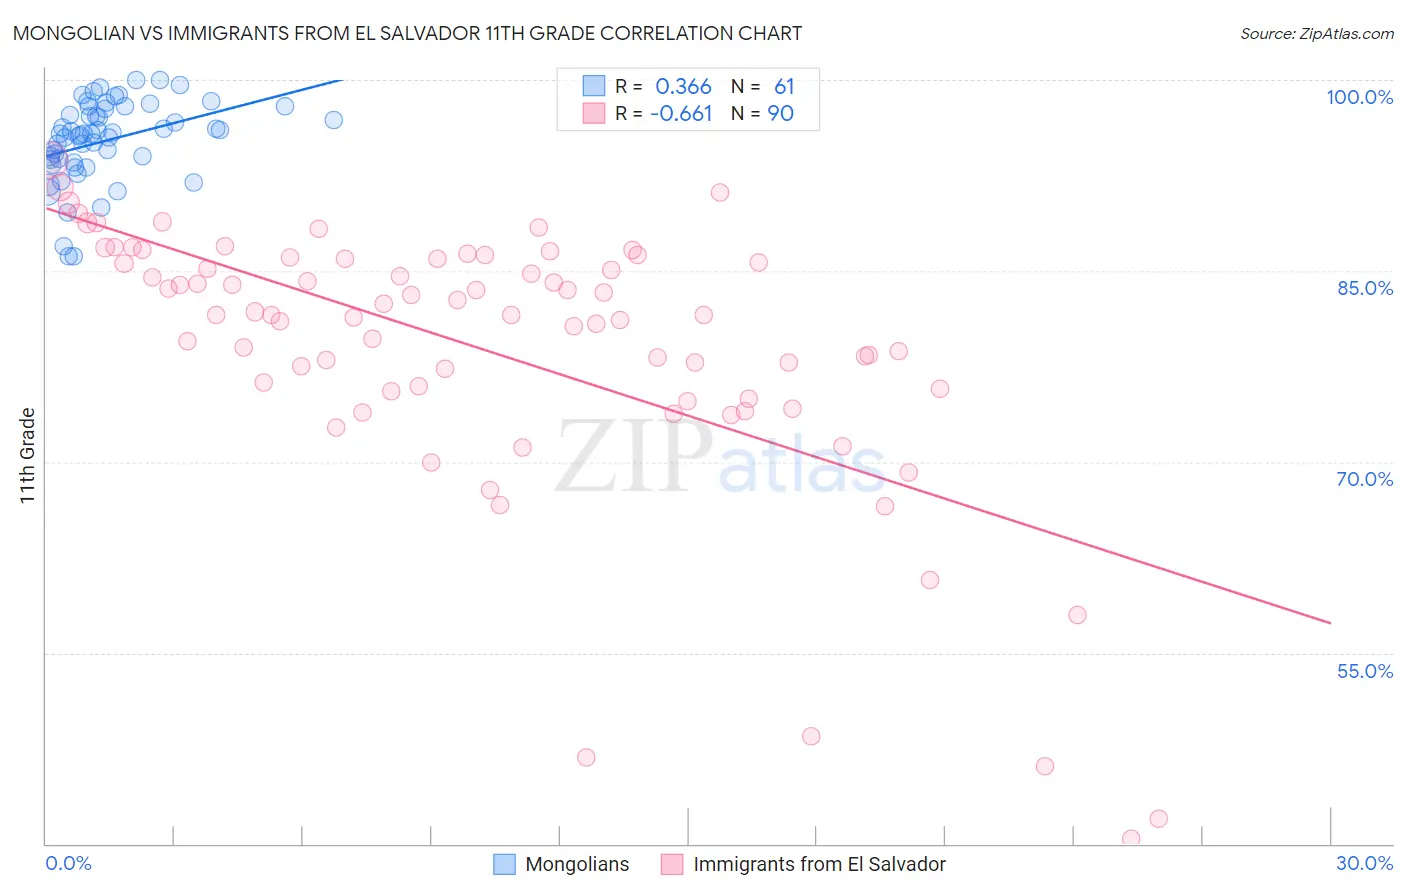
Mongolian vs Immigrants from El Salvador 11th Grade Correlation Chart
The statistical analysis conducted on geographies consisting of 140,362,004 people shows a mild positive correlation between the proportion of Mongolians and percentage of population with at least 11th grade education in the United States with a correlation coefficient (R) of 0.366 and weighted average of 93.0%. Similarly, the statistical analysis conducted on geographies consisting of 357,852,938 people shows a significant negative correlation between the proportion of Immigrants from El Salvador and percentage of population with at least 11th grade education in the United States with a correlation coefficient (R) of -0.661 and weighted average of 85.3%, a difference of 9.0%.
11th Grade Correlation Summary
| Measurement | Mongolian | Immigrants from El Salvador |
| Minimum | 86.1% | 40.3% |
| Maximum | 100.0% | 93.7% |
| Range | 13.9% | 53.3% |
| Mean | 95.2% | 78.8% |
| Median | 95.8% | 81.5% |
| Interquartile 25% (IQ1) | 93.6% | 75.6% |
| Interquartile 75% (IQ3) | 97.8% | 85.9% |
| Interquartile Range (IQR) | 4.2% | 10.4% |
| Standard Deviation (Sample) | 3.2% | 10.7% |
| Standard Deviation (Population) | 3.2% | 10.6% |
Similar Demographics by 11th Grade
Demographics Similar to Mongolians by 11th Grade
In terms of 11th grade, the demographic groups most similar to Mongolians are Delaware (93.0%, a difference of 0.010%), Immigrants from Italy (92.9%, a difference of 0.020%), Immigrants from Bosnia and Herzegovina (93.0%, a difference of 0.030%), Cree (92.9%, a difference of 0.030%), and Arab (92.9%, a difference of 0.040%).
| Demographics | Rating | Rank | 11th Grade |
| Basques | 95.2 /100 | #126 | Exceptional 93.2% |
| Immigrants | Kazakhstan | 92.4 /100 | #127 | Exceptional 93.1% |
| Immigrants | Jordan | 92.4 /100 | #128 | Exceptional 93.1% |
| Immigrants | Ukraine | 89.8 /100 | #129 | Excellent 93.0% |
| Albanians | 89.5 /100 | #130 | Excellent 93.0% |
| Egyptians | 89.5 /100 | #131 | Excellent 93.0% |
| Immigrants | Bosnia and Herzegovina | 89.0 /100 | #132 | Excellent 93.0% |
| Mongolians | 87.6 /100 | #133 | Excellent 93.0% |
| Delaware | 87.3 /100 | #134 | Excellent 93.0% |
| Immigrants | Italy | 86.6 /100 | #135 | Excellent 92.9% |
| Cree | 85.9 /100 | #136 | Excellent 92.9% |
| Arabs | 85.4 /100 | #137 | Excellent 92.9% |
| Immigrants | Brazil | 85.1 /100 | #138 | Excellent 92.9% |
| Crow | 84.1 /100 | #139 | Excellent 92.9% |
| Venezuelans | 83.4 /100 | #140 | Excellent 92.9% |
Demographics Similar to Immigrants from El Salvador by 11th Grade
In terms of 11th grade, the demographic groups most similar to Immigrants from El Salvador are Yakama (85.0%, a difference of 0.40%), Immigrants from Central America (84.9%, a difference of 0.43%), Immigrants from Guatemala (85.8%, a difference of 0.61%), Spanish American Indian (84.7%, a difference of 0.68%), and Mexican (86.1%, a difference of 0.94%).
| Demographics | Rating | Rank | 11th Grade |
| Immigrants | Yemen | 0.0 /100 | #333 | Tragic 87.1% |
| Houma | 0.0 /100 | #334 | Tragic 87.0% |
| Central Americans | 0.0 /100 | #335 | Tragic 86.9% |
| Immigrants | Dominican Republic | 0.0 /100 | #336 | Tragic 86.9% |
| Immigrants | Honduras | 0.0 /100 | #337 | Tragic 86.9% |
| Immigrants | Latin America | 0.0 /100 | #338 | Tragic 86.8% |
| Guatemalans | 0.0 /100 | #339 | Tragic 86.4% |
| Salvadorans | 0.0 /100 | #340 | Tragic 86.2% |
| Mexicans | 0.0 /100 | #341 | Tragic 86.1% |
| Immigrants | Guatemala | 0.0 /100 | #342 | Tragic 85.8% |
| Immigrants | El Salvador | 0.0 /100 | #343 | Tragic 85.3% |
| Yakama | 0.0 /100 | #344 | Tragic 85.0% |
| Immigrants | Central America | 0.0 /100 | #345 | Tragic 84.9% |
| Spanish American Indians | 0.0 /100 | #346 | Tragic 84.7% |
| Immigrants | Mexico | 0.0 /100 | #347 | Tragic 84.5% |