Mongolian vs Immigrants from Dominica 2nd Grade
COMPARE
Mongolian
Immigrants from Dominica
2nd Grade
2nd Grade Comparison
Mongolians
Immigrants from Dominica
97.8%
2ND GRADE
26.7/ 100
METRIC RATING
195th/ 347
METRIC RANK
97.0%
2ND GRADE
0.0/ 100
METRIC RATING
298th/ 347
METRIC RANK
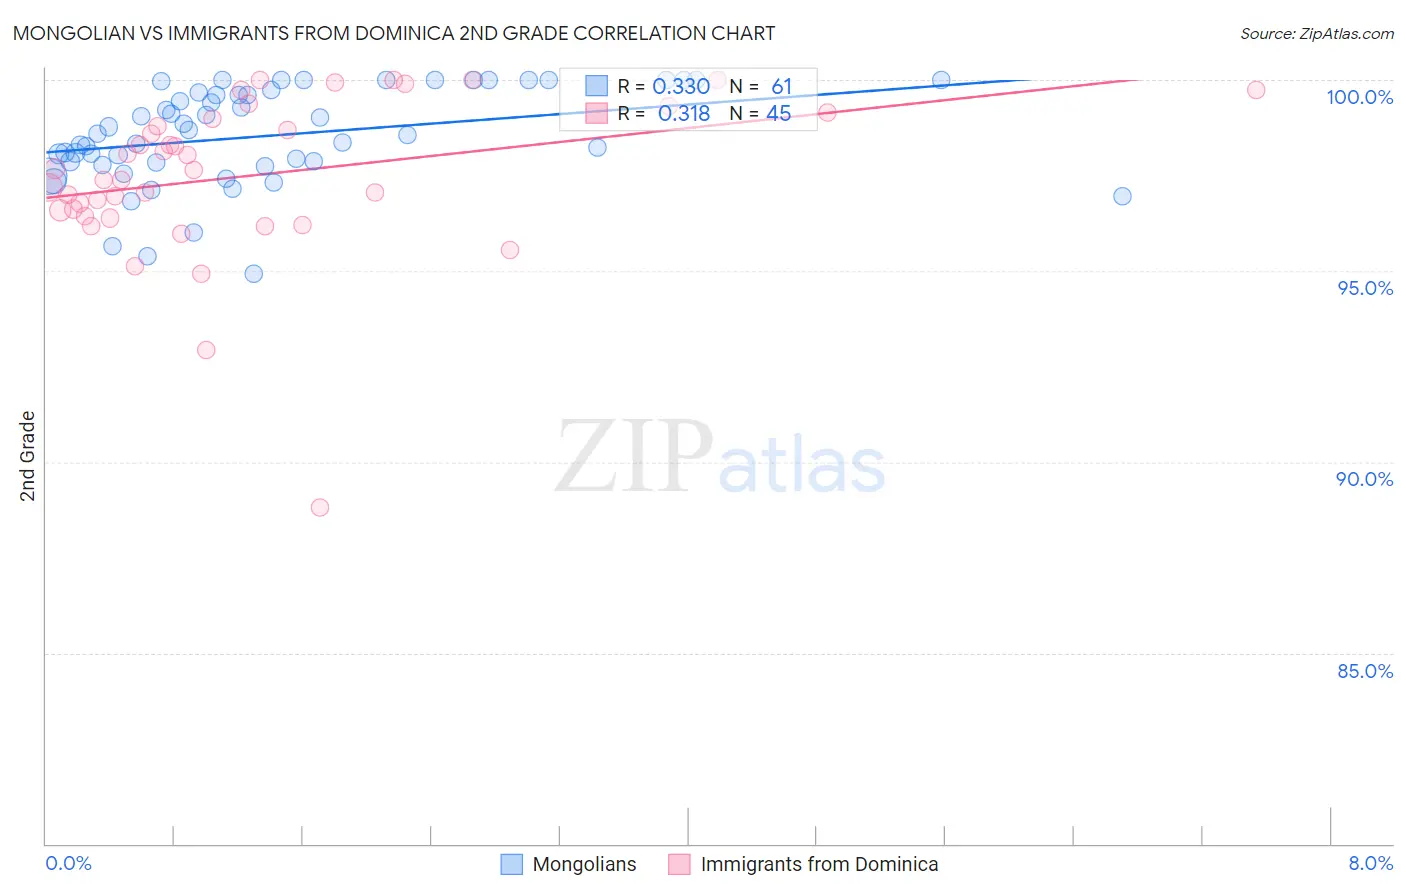
Mongolian vs Immigrants from Dominica 2nd Grade Correlation Chart
The statistical analysis conducted on geographies consisting of 140,362,004 people shows a mild positive correlation between the proportion of Mongolians and percentage of population with at least 2nd grade education in the United States with a correlation coefficient (R) of 0.330 and weighted average of 97.8%. Similarly, the statistical analysis conducted on geographies consisting of 83,794,115 people shows a mild positive correlation between the proportion of Immigrants from Dominica and percentage of population with at least 2nd grade education in the United States with a correlation coefficient (R) of 0.318 and weighted average of 97.0%, a difference of 0.80%.
2nd Grade Correlation Summary
| Measurement | Mongolian | Immigrants from Dominica |
| Minimum | 94.9% | 88.8% |
| Maximum | 100.0% | 100.0% |
| Range | 5.1% | 11.2% |
| Mean | 98.5% | 97.5% |
| Median | 98.6% | 97.6% |
| Interquartile 25% (IQ1) | 97.8% | 96.5% |
| Interquartile 75% (IQ3) | 99.7% | 99.1% |
| Interquartile Range (IQR) | 1.9% | 2.5% |
| Standard Deviation (Sample) | 1.3% | 2.1% |
| Standard Deviation (Population) | 1.3% | 2.1% |
Similar Demographics by 2nd Grade
Demographics Similar to Mongolians by 2nd Grade
In terms of 2nd grade, the demographic groups most similar to Mongolians are Paiute (97.8%, a difference of 0.0%), Immigrants from Kenya (97.8%, a difference of 0.0%), Immigrants from Uganda (97.8%, a difference of 0.0%), Guamanian/Chamorro (97.8%, a difference of 0.0%), and Black/African American (97.8%, a difference of 0.010%).
| Demographics | Rating | Rank | 2nd Grade |
| Immigrants | Kazakhstan | 35.6 /100 | #188 | Fair 97.8% |
| Panamanians | 33.5 /100 | #189 | Fair 97.8% |
| Immigrants | Taiwan | 31.8 /100 | #190 | Fair 97.8% |
| Paraguayans | 30.8 /100 | #191 | Fair 97.8% |
| Blacks/African Americans | 29.9 /100 | #192 | Fair 97.8% |
| Hawaiians | 28.5 /100 | #193 | Fair 97.8% |
| Paiute | 27.0 /100 | #194 | Fair 97.8% |
| Mongolians | 26.7 /100 | #195 | Fair 97.8% |
| Immigrants | Kenya | 26.4 /100 | #196 | Fair 97.8% |
| Immigrants | Uganda | 26.3 /100 | #197 | Fair 97.8% |
| Guamanians/Chamorros | 25.7 /100 | #198 | Fair 97.8% |
| Immigrants | Egypt | 24.4 /100 | #199 | Fair 97.8% |
| Immigrants | Lebanon | 20.9 /100 | #200 | Fair 97.8% |
| Tohono O'odham | 20.9 /100 | #201 | Fair 97.8% |
| Immigrants | Ukraine | 20.5 /100 | #202 | Fair 97.8% |
Demographics Similar to Immigrants from Dominica by 2nd Grade
In terms of 2nd grade, the demographic groups most similar to Immigrants from Dominica are Immigrants from Cuba (97.0%, a difference of 0.0%), Haitian (97.0%, a difference of 0.0%), Immigrants from South Eastern Asia (97.0%, a difference of 0.020%), Central American Indian (97.0%, a difference of 0.040%), and Somali (97.0%, a difference of 0.060%).
| Demographics | Rating | Rank | 2nd Grade |
| Immigrants | Afghanistan | 0.0 /100 | #291 | Tragic 97.2% |
| Immigrants | Eritrea | 0.0 /100 | #292 | Tragic 97.2% |
| British West Indians | 0.0 /100 | #293 | Tragic 97.2% |
| Malaysians | 0.0 /100 | #294 | Tragic 97.1% |
| Immigrants | Grenada | 0.0 /100 | #295 | Tragic 97.1% |
| Immigrants | Immigrants | 0.0 /100 | #296 | Tragic 97.1% |
| Immigrants | Cuba | 0.0 /100 | #297 | Tragic 97.0% |
| Immigrants | Dominica | 0.0 /100 | #298 | Tragic 97.0% |
| Haitians | 0.0 /100 | #299 | Tragic 97.0% |
| Immigrants | South Eastern Asia | 0.0 /100 | #300 | Tragic 97.0% |
| Central American Indians | 0.0 /100 | #301 | Tragic 97.0% |
| Somalis | 0.0 /100 | #302 | Tragic 97.0% |
| Ecuadorians | 0.0 /100 | #303 | Tragic 96.9% |
| Immigrants | Caribbean | 0.0 /100 | #304 | Tragic 96.9% |
| Nicaraguans | 0.0 /100 | #305 | Tragic 96.9% |