Mongolian vs Immigrants from Haiti 2nd Grade
COMPARE
Mongolian
Immigrants from Haiti
2nd Grade
2nd Grade Comparison
Mongolians
Immigrants from Haiti
97.8%
2ND GRADE
26.7/ 100
METRIC RATING
195th/ 347
METRIC RANK
96.8%
2ND GRADE
0.0/ 100
METRIC RATING
308th/ 347
METRIC RANK
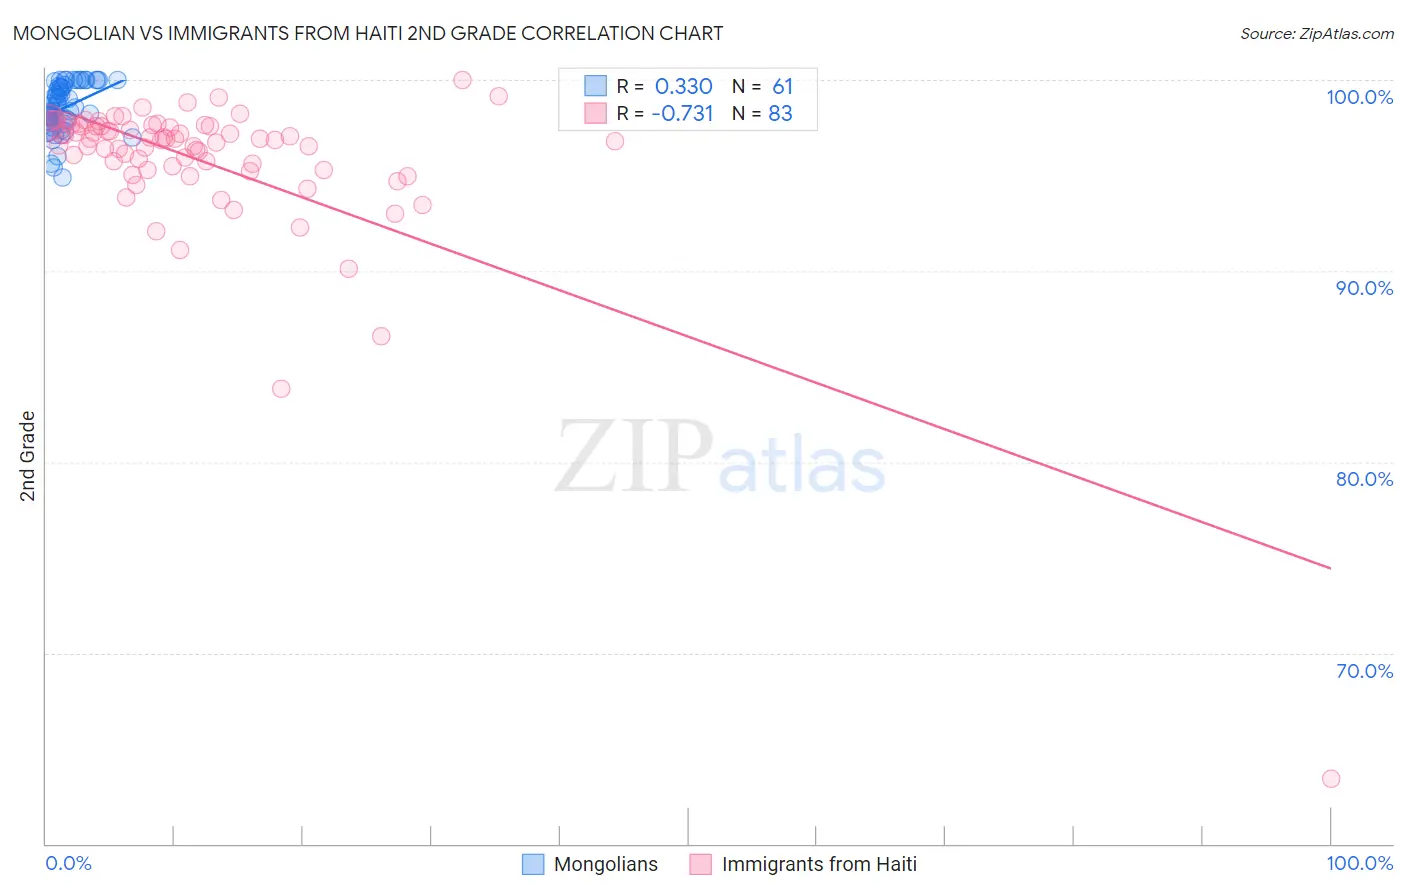
Mongolian vs Immigrants from Haiti 2nd Grade Correlation Chart
The statistical analysis conducted on geographies consisting of 140,362,004 people shows a mild positive correlation between the proportion of Mongolians and percentage of population with at least 2nd grade education in the United States with a correlation coefficient (R) of 0.330 and weighted average of 97.8%. Similarly, the statistical analysis conducted on geographies consisting of 225,286,718 people shows a strong negative correlation between the proportion of Immigrants from Haiti and percentage of population with at least 2nd grade education in the United States with a correlation coefficient (R) of -0.731 and weighted average of 96.8%, a difference of 0.98%.
2nd Grade Correlation Summary
| Measurement | Mongolian | Immigrants from Haiti |
| Minimum | 94.9% | 63.4% |
| Maximum | 100.0% | 100.0% |
| Range | 5.1% | 36.6% |
| Mean | 98.5% | 95.8% |
| Median | 98.6% | 96.8% |
| Interquartile 25% (IQ1) | 97.8% | 95.3% |
| Interquartile 75% (IQ3) | 99.7% | 97.6% |
| Interquartile Range (IQR) | 1.9% | 2.3% |
| Standard Deviation (Sample) | 1.3% | 4.4% |
| Standard Deviation (Population) | 1.3% | 4.3% |
Similar Demographics by 2nd Grade
Demographics Similar to Mongolians by 2nd Grade
In terms of 2nd grade, the demographic groups most similar to Mongolians are Paiute (97.8%, a difference of 0.0%), Immigrants from Kenya (97.8%, a difference of 0.0%), Immigrants from Uganda (97.8%, a difference of 0.0%), Guamanian/Chamorro (97.8%, a difference of 0.0%), and Black/African American (97.8%, a difference of 0.010%).
| Demographics | Rating | Rank | 2nd Grade |
| Immigrants | Kazakhstan | 35.6 /100 | #188 | Fair 97.8% |
| Panamanians | 33.5 /100 | #189 | Fair 97.8% |
| Immigrants | Taiwan | 31.8 /100 | #190 | Fair 97.8% |
| Paraguayans | 30.8 /100 | #191 | Fair 97.8% |
| Blacks/African Americans | 29.9 /100 | #192 | Fair 97.8% |
| Hawaiians | 28.5 /100 | #193 | Fair 97.8% |
| Paiute | 27.0 /100 | #194 | Fair 97.8% |
| Mongolians | 26.7 /100 | #195 | Fair 97.8% |
| Immigrants | Kenya | 26.4 /100 | #196 | Fair 97.8% |
| Immigrants | Uganda | 26.3 /100 | #197 | Fair 97.8% |
| Guamanians/Chamorros | 25.7 /100 | #198 | Fair 97.8% |
| Immigrants | Egypt | 24.4 /100 | #199 | Fair 97.8% |
| Immigrants | Lebanon | 20.9 /100 | #200 | Fair 97.8% |
| Tohono O'odham | 20.9 /100 | #201 | Fair 97.8% |
| Immigrants | Ukraine | 20.5 /100 | #202 | Fair 97.8% |
Demographics Similar to Immigrants from Haiti by 2nd Grade
In terms of 2nd grade, the demographic groups most similar to Immigrants from Haiti are Immigrants from the Azores (96.8%, a difference of 0.010%), Belizean (96.8%, a difference of 0.010%), Sri Lankan (96.8%, a difference of 0.010%), Guyanese (96.8%, a difference of 0.020%), and Cape Verdean (96.8%, a difference of 0.020%).
| Demographics | Rating | Rank | 2nd Grade |
| Central American Indians | 0.0 /100 | #301 | Tragic 97.0% |
| Somalis | 0.0 /100 | #302 | Tragic 97.0% |
| Ecuadorians | 0.0 /100 | #303 | Tragic 96.9% |
| Immigrants | Caribbean | 0.0 /100 | #304 | Tragic 96.9% |
| Nicaraguans | 0.0 /100 | #305 | Tragic 96.9% |
| Immigrants | Somalia | 0.0 /100 | #306 | Tragic 96.9% |
| Immigrants | Azores | 0.0 /100 | #307 | Tragic 96.8% |
| Immigrants | Haiti | 0.0 /100 | #308 | Tragic 96.8% |
| Belizeans | 0.0 /100 | #309 | Tragic 96.8% |
| Sri Lankans | 0.0 /100 | #310 | Tragic 96.8% |
| Guyanese | 0.0 /100 | #311 | Tragic 96.8% |
| Cape Verdeans | 0.0 /100 | #312 | Tragic 96.8% |
| Hispanics or Latinos | 0.0 /100 | #313 | Tragic 96.8% |
| Immigrants | Ecuador | 0.0 /100 | #314 | Tragic 96.8% |
| Immigrants | Belize | 0.0 /100 | #315 | Tragic 96.8% |