Mongolian vs Guatemalan 2nd Grade
COMPARE
Mongolian
Guatemalan
2nd Grade
2nd Grade Comparison
Mongolians
Guatemalans
97.8%
2ND GRADE
26.7/ 100
METRIC RATING
195th/ 347
METRIC RANK
96.3%
2ND GRADE
0.0/ 100
METRIC RATING
339th/ 347
METRIC RANK
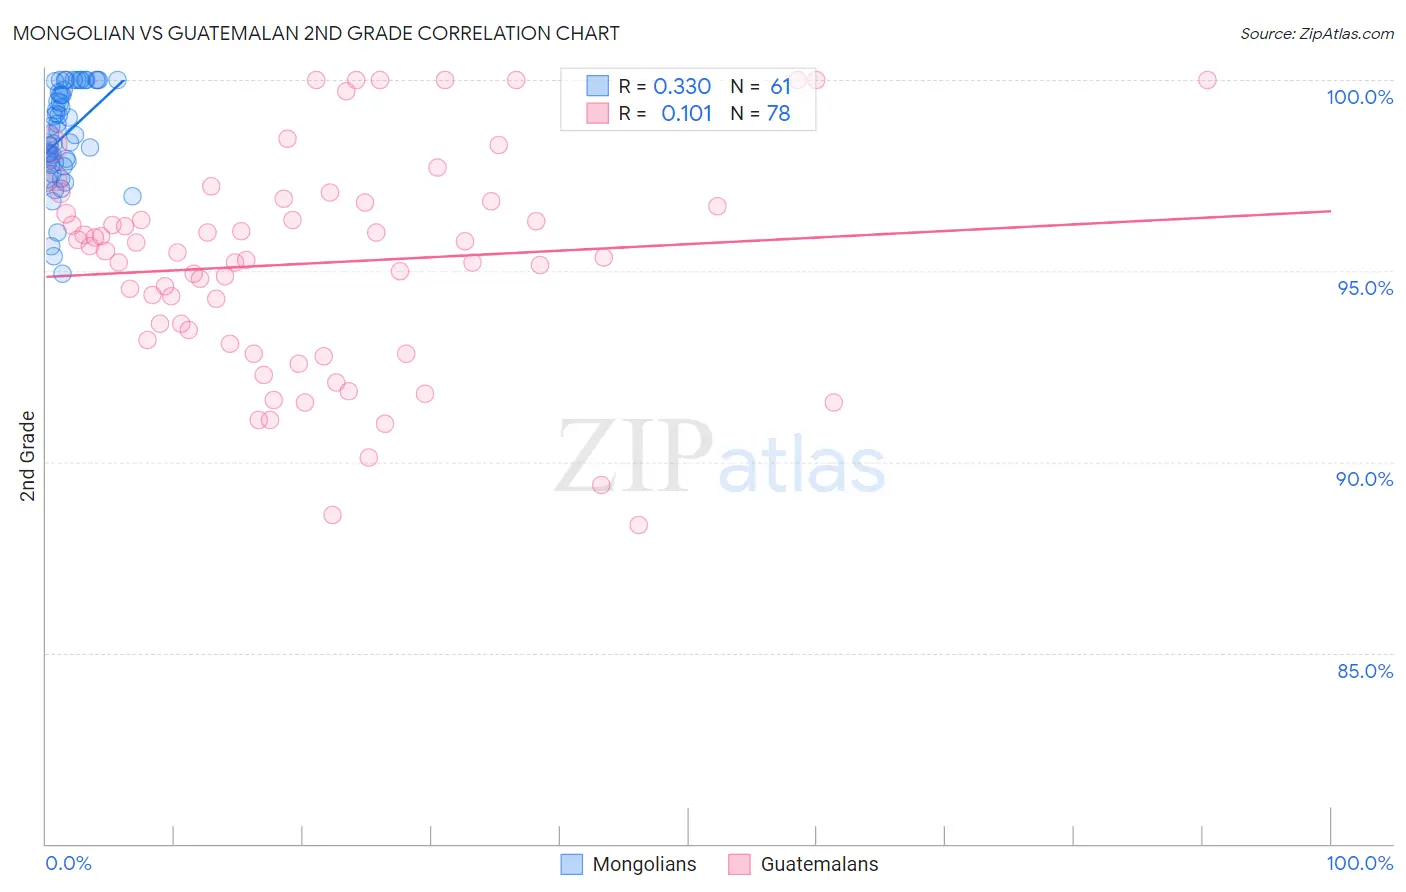
Mongolian vs Guatemalan 2nd Grade Correlation Chart
The statistical analysis conducted on geographies consisting of 140,362,004 people shows a mild positive correlation between the proportion of Mongolians and percentage of population with at least 2nd grade education in the United States with a correlation coefficient (R) of 0.330 and weighted average of 97.8%. Similarly, the statistical analysis conducted on geographies consisting of 409,566,469 people shows a poor positive correlation between the proportion of Guatemalans and percentage of population with at least 2nd grade education in the United States with a correlation coefficient (R) of 0.101 and weighted average of 96.3%, a difference of 1.5%.
2nd Grade Correlation Summary
| Measurement | Mongolian | Guatemalan |
| Minimum | 94.9% | 88.3% |
| Maximum | 100.0% | 100.0% |
| Range | 5.1% | 11.7% |
| Mean | 98.5% | 95.2% |
| Median | 98.6% | 95.5% |
| Interquartile 25% (IQ1) | 97.8% | 93.2% |
| Interquartile 75% (IQ3) | 99.7% | 96.8% |
| Interquartile Range (IQR) | 1.9% | 3.6% |
| Standard Deviation (Sample) | 1.3% | 2.8% |
| Standard Deviation (Population) | 1.3% | 2.8% |
Similar Demographics by 2nd Grade
Demographics Similar to Mongolians by 2nd Grade
In terms of 2nd grade, the demographic groups most similar to Mongolians are Paiute (97.8%, a difference of 0.0%), Immigrants from Kenya (97.8%, a difference of 0.0%), Immigrants from Uganda (97.8%, a difference of 0.0%), Guamanian/Chamorro (97.8%, a difference of 0.0%), and Black/African American (97.8%, a difference of 0.010%).
| Demographics | Rating | Rank | 2nd Grade |
| Immigrants | Kazakhstan | 35.6 /100 | #188 | Fair 97.8% |
| Panamanians | 33.5 /100 | #189 | Fair 97.8% |
| Immigrants | Taiwan | 31.8 /100 | #190 | Fair 97.8% |
| Paraguayans | 30.8 /100 | #191 | Fair 97.8% |
| Blacks/African Americans | 29.9 /100 | #192 | Fair 97.8% |
| Hawaiians | 28.5 /100 | #193 | Fair 97.8% |
| Paiute | 27.0 /100 | #194 | Fair 97.8% |
| Mongolians | 26.7 /100 | #195 | Fair 97.8% |
| Immigrants | Kenya | 26.4 /100 | #196 | Fair 97.8% |
| Immigrants | Uganda | 26.3 /100 | #197 | Fair 97.8% |
| Guamanians/Chamorros | 25.7 /100 | #198 | Fair 97.8% |
| Immigrants | Egypt | 24.4 /100 | #199 | Fair 97.8% |
| Immigrants | Lebanon | 20.9 /100 | #200 | Fair 97.8% |
| Tohono O'odham | 20.9 /100 | #201 | Fair 97.8% |
| Immigrants | Ukraine | 20.5 /100 | #202 | Fair 97.8% |
Demographics Similar to Guatemalans by 2nd Grade
In terms of 2nd grade, the demographic groups most similar to Guatemalans are Immigrants from Cabo Verde (96.3%, a difference of 0.030%), Immigrants from Cambodia (96.4%, a difference of 0.050%), Immigrants from Fiji (96.4%, a difference of 0.060%), Yakama (96.4%, a difference of 0.070%), and Central American (96.4%, a difference of 0.080%).
| Demographics | Rating | Rank | 2nd Grade |
| Bangladeshis | 0.0 /100 | #332 | Tragic 96.5% |
| Immigrants | Dominican Republic | 0.0 /100 | #333 | Tragic 96.4% |
| Central Americans | 0.0 /100 | #334 | Tragic 96.4% |
| Yakama | 0.0 /100 | #335 | Tragic 96.4% |
| Immigrants | Fiji | 0.0 /100 | #336 | Tragic 96.4% |
| Immigrants | Cambodia | 0.0 /100 | #337 | Tragic 96.4% |
| Immigrants | Cabo Verde | 0.0 /100 | #338 | Tragic 96.3% |
| Guatemalans | 0.0 /100 | #339 | Tragic 96.3% |
| Immigrants | Guatemala | 0.0 /100 | #340 | Tragic 96.2% |
| Immigrants | Central America | 0.0 /100 | #341 | Tragic 96.2% |
| Immigrants | Mexico | 0.0 /100 | #342 | Tragic 96.1% |
| Nepalese | 0.0 /100 | #343 | Tragic 96.1% |
| Salvadorans | 0.0 /100 | #344 | Tragic 96.0% |
| Immigrants | El Salvador | 0.0 /100 | #345 | Tragic 95.9% |
| Immigrants | Yemen | 0.0 /100 | #346 | Tragic 95.7% |