Lebanese vs Immigrants from Italy 2nd Grade
COMPARE
Lebanese
Immigrants from Italy
2nd Grade
2nd Grade Comparison
Lebanese
Immigrants from Italy
98.1%
2ND GRADE
94.2/ 100
METRIC RATING
122nd/ 347
METRIC RANK
97.9%
2ND GRADE
60.2/ 100
METRIC RATING
162nd/ 347
METRIC RANK
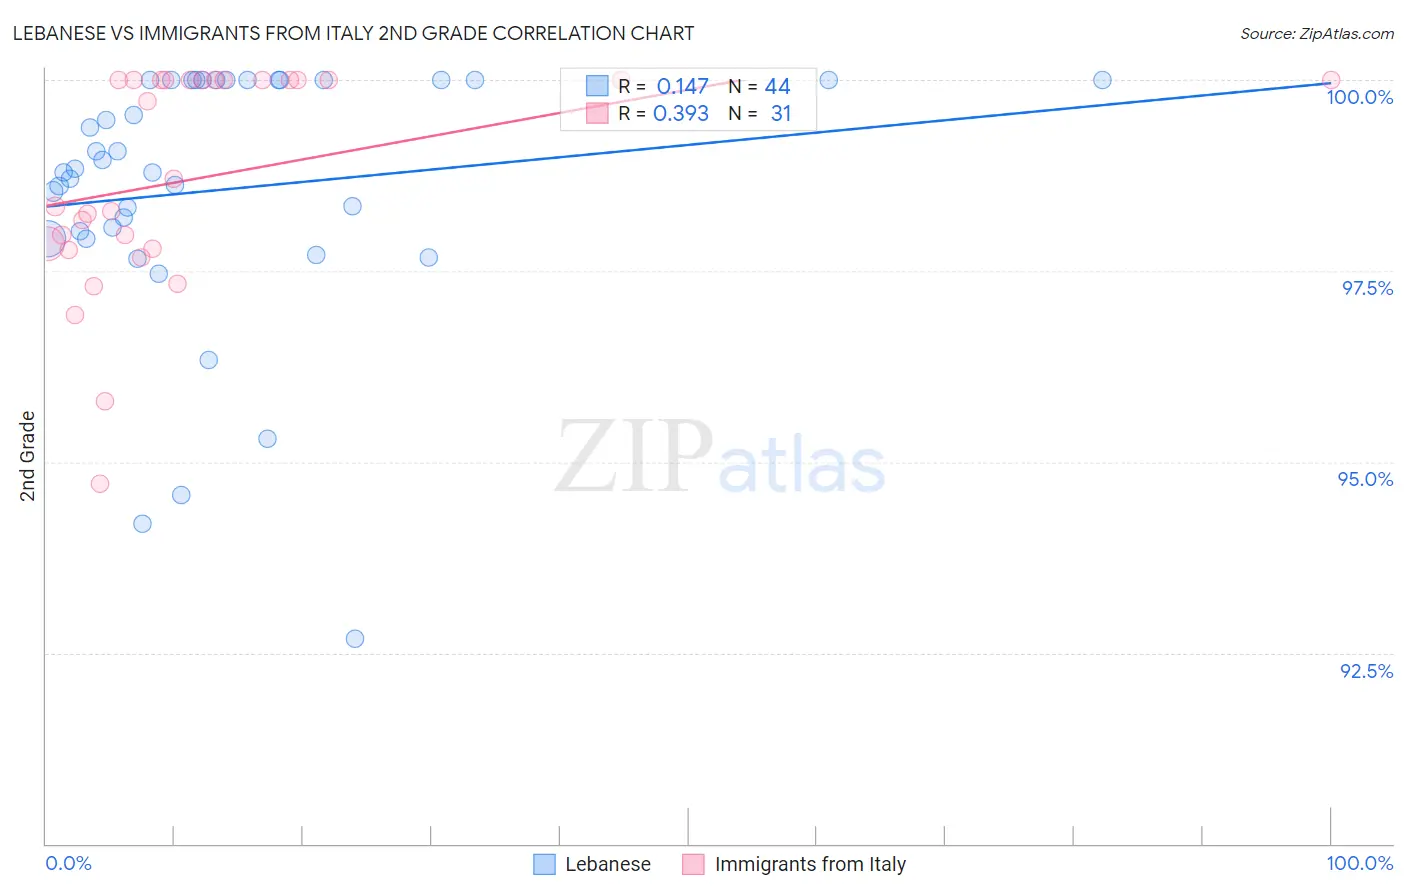
Lebanese vs Immigrants from Italy 2nd Grade Correlation Chart
The statistical analysis conducted on geographies consisting of 401,624,157 people shows a poor positive correlation between the proportion of Lebanese and percentage of population with at least 2nd grade education in the United States with a correlation coefficient (R) of 0.147 and weighted average of 98.1%. Similarly, the statistical analysis conducted on geographies consisting of 324,225,917 people shows a mild positive correlation between the proportion of Immigrants from Italy and percentage of population with at least 2nd grade education in the United States with a correlation coefficient (R) of 0.393 and weighted average of 97.9%, a difference of 0.19%.
2nd Grade Correlation Summary
| Measurement | Lebanese | Immigrants from Italy |
| Minimum | 92.7% | 94.7% |
| Maximum | 100.0% | 100.0% |
| Range | 7.3% | 5.3% |
| Mean | 98.6% | 98.7% |
| Median | 98.8% | 98.7% |
| Interquartile 25% (IQ1) | 98.0% | 97.8% |
| Interquartile 75% (IQ3) | 100.0% | 100.0% |
| Interquartile Range (IQR) | 2.0% | 2.2% |
| Standard Deviation (Sample) | 1.7% | 1.4% |
| Standard Deviation (Population) | 1.7% | 1.4% |
Similar Demographics by 2nd Grade
Demographics Similar to Lebanese by 2nd Grade
In terms of 2nd grade, the demographic groups most similar to Lebanese are Immigrants from Zimbabwe (98.1%, a difference of 0.0%), Immigrants from Japan (98.1%, a difference of 0.0%), Menominee (98.1%, a difference of 0.0%), Iroquois (98.1%, a difference of 0.0%), and Syrian (98.1%, a difference of 0.0%).
| Demographics | Rating | Rank | 2nd Grade |
| Iranians | 95.9 /100 | #115 | Exceptional 98.1% |
| Spanish | 95.8 /100 | #116 | Exceptional 98.1% |
| Ute | 95.7 /100 | #117 | Exceptional 98.1% |
| Immigrants | France | 95.6 /100 | #118 | Exceptional 98.1% |
| Thais | 95.3 /100 | #119 | Exceptional 98.1% |
| Okinawans | 94.9 /100 | #120 | Exceptional 98.1% |
| Immigrants | Zimbabwe | 94.4 /100 | #121 | Exceptional 98.1% |
| Lebanese | 94.2 /100 | #122 | Exceptional 98.1% |
| Immigrants | Japan | 94.1 /100 | #123 | Exceptional 98.1% |
| Menominee | 94.1 /100 | #124 | Exceptional 98.1% |
| Iroquois | 94.1 /100 | #125 | Exceptional 98.1% |
| Syrians | 94.0 /100 | #126 | Exceptional 98.1% |
| Immigrants | Saudi Arabia | 93.6 /100 | #127 | Exceptional 98.1% |
| Immigrants | Serbia | 92.3 /100 | #128 | Exceptional 98.1% |
| Immigrants | Croatia | 92.1 /100 | #129 | Exceptional 98.1% |
Demographics Similar to Immigrants from Italy by 2nd Grade
In terms of 2nd grade, the demographic groups most similar to Immigrants from Italy are Immigrants from Eastern Europe (97.9%, a difference of 0.0%), Immigrants from Russia (97.9%, a difference of 0.0%), Bermudan (97.9%, a difference of 0.0%), French American Indian (97.9%, a difference of 0.010%), and Dutch West Indian (97.9%, a difference of 0.010%).
| Demographics | Rating | Rank | 2nd Grade |
| French American Indians | 64.3 /100 | #155 | Good 97.9% |
| Dutch West Indians | 63.8 /100 | #156 | Good 97.9% |
| Venezuelans | 63.3 /100 | #157 | Good 97.9% |
| Immigrants | Iran | 62.8 /100 | #158 | Good 97.9% |
| Comanche | 62.8 /100 | #159 | Good 97.9% |
| Immigrants | Eastern Europe | 61.1 /100 | #160 | Good 97.9% |
| Immigrants | Russia | 60.3 /100 | #161 | Good 97.9% |
| Immigrants | Italy | 60.2 /100 | #162 | Good 97.9% |
| Bermudans | 59.4 /100 | #163 | Average 97.9% |
| Ugandans | 56.6 /100 | #164 | Average 97.9% |
| Spanish Americans | 56.4 /100 | #165 | Average 97.9% |
| Immigrants | Jordan | 56.3 /100 | #166 | Average 97.9% |
| Chileans | 56.1 /100 | #167 | Average 97.9% |
| Brazilians | 55.8 /100 | #168 | Average 97.9% |
| Immigrants | Spain | 55.4 /100 | #169 | Average 97.9% |