Argentinean vs Immigrants from El Salvador 11th Grade
COMPARE
Argentinean
Immigrants from El Salvador
11th Grade
11th Grade Comparison
Argentineans
Immigrants from El Salvador
92.7%
11TH GRADE
73.4/ 100
METRIC RATING
155th/ 347
METRIC RANK
85.3%
11TH GRADE
0.0/ 100
METRIC RATING
343rd/ 347
METRIC RANK
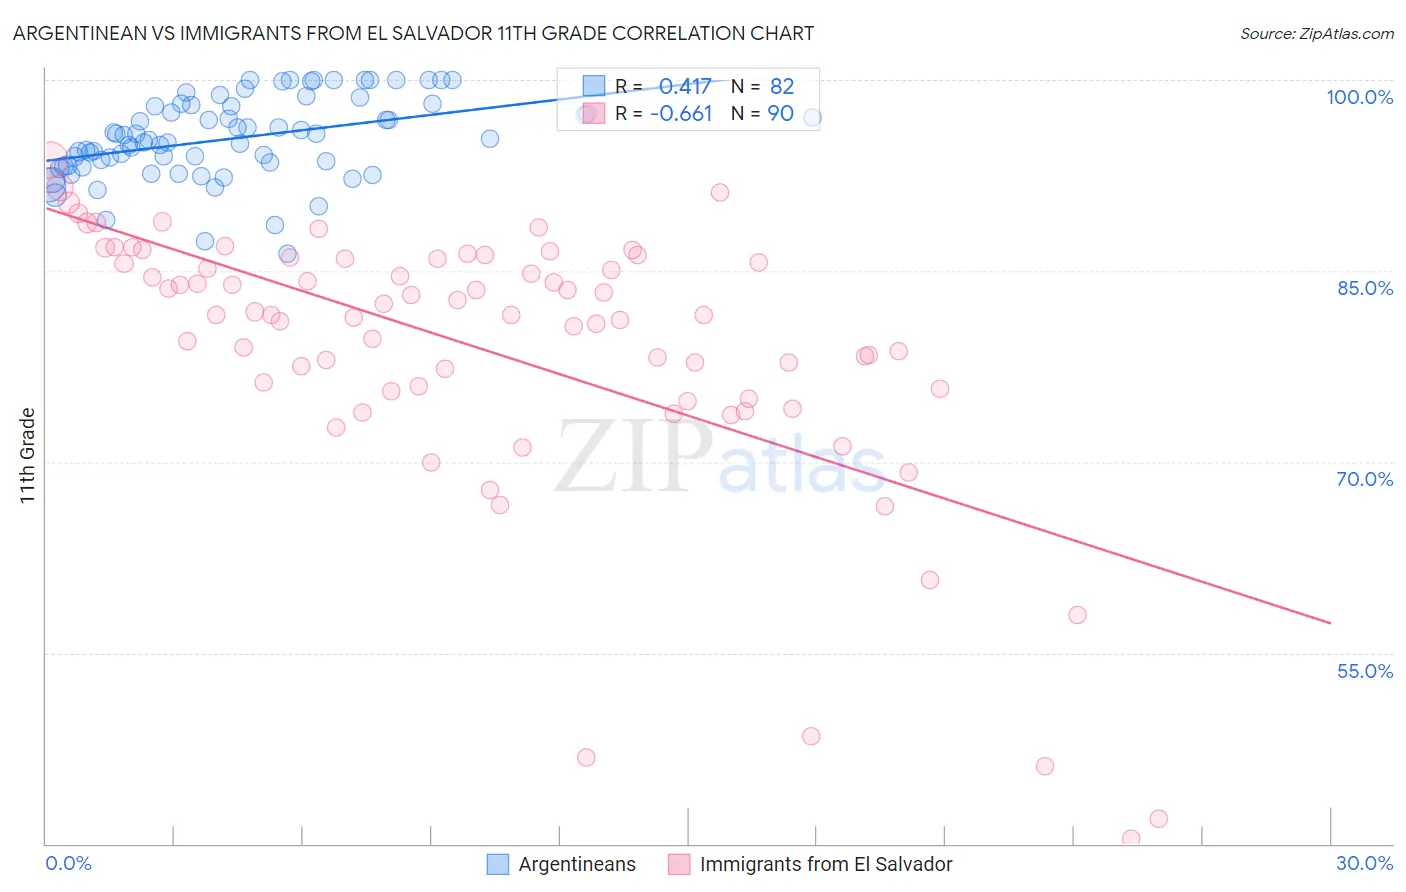
Argentinean vs Immigrants from El Salvador 11th Grade Correlation Chart
The statistical analysis conducted on geographies consisting of 297,143,432 people shows a moderate positive correlation between the proportion of Argentineans and percentage of population with at least 11th grade education in the United States with a correlation coefficient (R) of 0.417 and weighted average of 92.7%. Similarly, the statistical analysis conducted on geographies consisting of 357,852,938 people shows a significant negative correlation between the proportion of Immigrants from El Salvador and percentage of population with at least 11th grade education in the United States with a correlation coefficient (R) of -0.661 and weighted average of 85.3%, a difference of 8.7%.
11th Grade Correlation Summary
| Measurement | Argentinean | Immigrants from El Salvador |
| Minimum | 86.3% | 40.3% |
| Maximum | 100.0% | 93.7% |
| Range | 13.7% | 53.3% |
| Mean | 95.4% | 78.8% |
| Median | 95.3% | 81.5% |
| Interquartile 25% (IQ1) | 93.3% | 75.6% |
| Interquartile 75% (IQ3) | 97.9% | 85.9% |
| Interquartile Range (IQR) | 4.6% | 10.4% |
| Standard Deviation (Sample) | 3.2% | 10.7% |
| Standard Deviation (Population) | 3.2% | 10.6% |
Similar Demographics by 11th Grade
Demographics Similar to Argentineans by 11th Grade
In terms of 11th grade, the demographic groups most similar to Argentineans are Osage (92.7%, a difference of 0.0%), Immigrants from Spain (92.7%, a difference of 0.0%), Potawatomi (92.8%, a difference of 0.010%), Iraqi (92.8%, a difference of 0.010%), and Brazilian (92.8%, a difference of 0.010%).
| Demographics | Rating | Rank | 11th Grade |
| Hmong | 78.6 /100 | #148 | Good 92.8% |
| Immigrants | Poland | 78.5 /100 | #149 | Good 92.8% |
| Immigrants | Egypt | 77.5 /100 | #150 | Good 92.8% |
| Potawatomi | 74.3 /100 | #151 | Good 92.8% |
| Iraqis | 74.2 /100 | #152 | Good 92.8% |
| Brazilians | 73.9 /100 | #153 | Good 92.8% |
| Osage | 73.4 /100 | #154 | Good 92.7% |
| Argentineans | 73.4 /100 | #155 | Good 92.7% |
| Immigrants | Spain | 73.0 /100 | #156 | Good 92.7% |
| Immigrants | Eastern Asia | 72.6 /100 | #157 | Good 92.7% |
| Immigrants | Venezuela | 72.0 /100 | #158 | Good 92.7% |
| Americans | 71.7 /100 | #159 | Good 92.7% |
| Immigrants | Lebanon | 70.7 /100 | #160 | Good 92.7% |
| Immigrants | Argentina | 69.8 /100 | #161 | Good 92.7% |
| Paraguayans | 68.7 /100 | #162 | Good 92.7% |
Demographics Similar to Immigrants from El Salvador by 11th Grade
In terms of 11th grade, the demographic groups most similar to Immigrants from El Salvador are Yakama (85.0%, a difference of 0.40%), Immigrants from Central America (84.9%, a difference of 0.43%), Immigrants from Guatemala (85.8%, a difference of 0.61%), Spanish American Indian (84.7%, a difference of 0.68%), and Mexican (86.1%, a difference of 0.94%).
| Demographics | Rating | Rank | 11th Grade |
| Immigrants | Yemen | 0.0 /100 | #333 | Tragic 87.1% |
| Houma | 0.0 /100 | #334 | Tragic 87.0% |
| Central Americans | 0.0 /100 | #335 | Tragic 86.9% |
| Immigrants | Dominican Republic | 0.0 /100 | #336 | Tragic 86.9% |
| Immigrants | Honduras | 0.0 /100 | #337 | Tragic 86.9% |
| Immigrants | Latin America | 0.0 /100 | #338 | Tragic 86.8% |
| Guatemalans | 0.0 /100 | #339 | Tragic 86.4% |
| Salvadorans | 0.0 /100 | #340 | Tragic 86.2% |
| Mexicans | 0.0 /100 | #341 | Tragic 86.1% |
| Immigrants | Guatemala | 0.0 /100 | #342 | Tragic 85.8% |
| Immigrants | El Salvador | 0.0 /100 | #343 | Tragic 85.3% |
| Yakama | 0.0 /100 | #344 | Tragic 85.0% |
| Immigrants | Central America | 0.0 /100 | #345 | Tragic 84.9% |
| Spanish American Indians | 0.0 /100 | #346 | Tragic 84.7% |
| Immigrants | Mexico | 0.0 /100 | #347 | Tragic 84.5% |