Mongolian vs Immigrants from Egypt 8th Grade
COMPARE
Mongolian
Immigrants from Egypt
8th Grade
8th Grade Comparison
Mongolians
Immigrants from Egypt
95.8%
8TH GRADE
53.0/ 100
METRIC RATING
173rd/ 347
METRIC RANK
95.7%
8TH GRADE
37.9/ 100
METRIC RATING
182nd/ 347
METRIC RANK
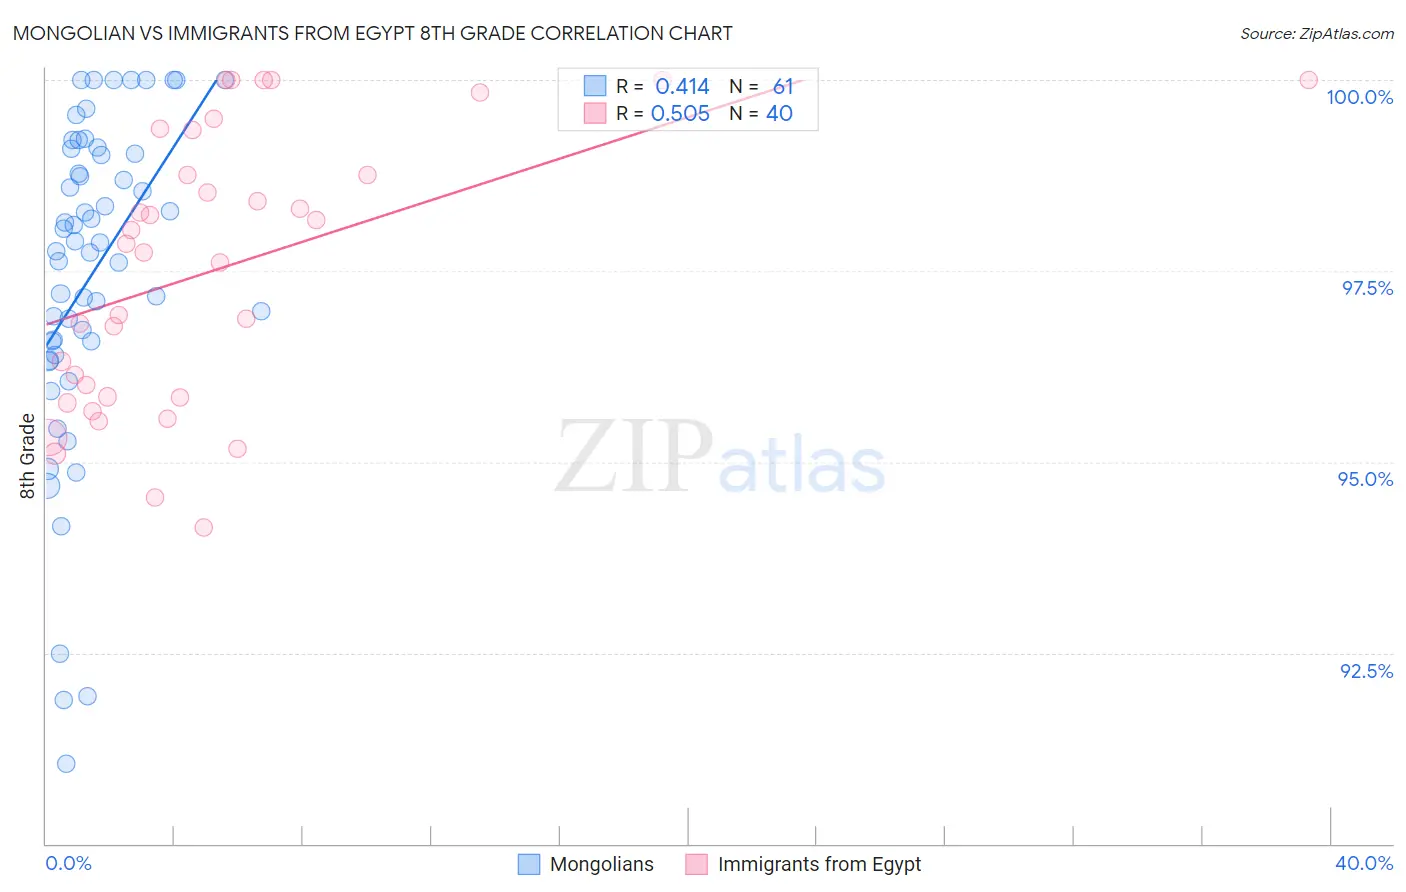
Mongolian vs Immigrants from Egypt 8th Grade Correlation Chart
The statistical analysis conducted on geographies consisting of 140,362,004 people shows a moderate positive correlation between the proportion of Mongolians and percentage of population with at least 8th grade education in the United States with a correlation coefficient (R) of 0.414 and weighted average of 95.8%. Similarly, the statistical analysis conducted on geographies consisting of 245,484,455 people shows a substantial positive correlation between the proportion of Immigrants from Egypt and percentage of population with at least 8th grade education in the United States with a correlation coefficient (R) of 0.505 and weighted average of 95.7%, a difference of 0.10%.
8th Grade Correlation Summary
| Measurement | Mongolian | Immigrants from Egypt |
| Minimum | 91.0% | 94.1% |
| Maximum | 100.0% | 100.0% |
| Range | 9.0% | 5.9% |
| Mean | 97.4% | 97.5% |
| Median | 97.9% | 97.8% |
| Interquartile 25% (IQ1) | 96.5% | 95.8% |
| Interquartile 75% (IQ3) | 99.1% | 99.1% |
| Interquartile Range (IQR) | 2.6% | 3.2% |
| Standard Deviation (Sample) | 2.1% | 1.8% |
| Standard Deviation (Population) | 2.1% | 1.8% |
Demographics Similar to Mongolians and Immigrants from Egypt by 8th Grade
In terms of 8th grade, the demographic groups most similar to Mongolians are Chilean (95.7%, a difference of 0.020%), Immigrants from Albania (95.7%, a difference of 0.020%), Egyptian (95.8%, a difference of 0.030%), Immigrants from Korea (95.8%, a difference of 0.030%), and Pakistani (95.7%, a difference of 0.030%). Similarly, the demographic groups most similar to Immigrants from Egypt are Immigrants from Spain (95.7%, a difference of 0.010%), Immigrants from Iraq (95.6%, a difference of 0.010%), Immigrants from Uganda (95.6%, a difference of 0.010%), Iraqi (95.7%, a difference of 0.020%), and Black/African American (95.6%, a difference of 0.020%).
| Demographics | Rating | Rank | 8th Grade |
| Spaniards | 60.0 /100 | #167 | Good 95.8% |
| Immigrants | Ukraine | 59.5 /100 | #168 | Average 95.8% |
| Immigrants | Iran | 58.6 /100 | #169 | Average 95.8% |
| Ute | 58.5 /100 | #170 | Average 95.8% |
| Egyptians | 58.2 /100 | #171 | Average 95.8% |
| Immigrants | Korea | 57.9 /100 | #172 | Average 95.8% |
| Mongolians | 53.0 /100 | #173 | Average 95.8% |
| Chileans | 50.0 /100 | #174 | Average 95.7% |
| Immigrants | Albania | 49.6 /100 | #175 | Average 95.7% |
| Pakistanis | 48.8 /100 | #176 | Average 95.7% |
| Marshallese | 47.6 /100 | #177 | Average 95.7% |
| Venezuelans | 47.5 /100 | #178 | Average 95.7% |
| Immigrants | Brazil | 45.4 /100 | #179 | Average 95.7% |
| Iraqis | 40.5 /100 | #180 | Average 95.7% |
| Immigrants | Spain | 38.7 /100 | #181 | Fair 95.7% |
| Immigrants | Egypt | 37.9 /100 | #182 | Fair 95.7% |
| Immigrants | Iraq | 36.2 /100 | #183 | Fair 95.6% |
| Immigrants | Uganda | 36.0 /100 | #184 | Fair 95.6% |
| Blacks/African Americans | 34.8 /100 | #185 | Fair 95.6% |
| Brazilians | 34.8 /100 | #186 | Fair 95.6% |
| Sudanese | 33.0 /100 | #187 | Fair 95.6% |