Mongolian vs Immigrants from Mexico 8th Grade
COMPARE
Mongolian
Immigrants from Mexico
8th Grade
8th Grade Comparison
Mongolians
Immigrants from Mexico
95.8%
8TH GRADE
53.0/ 100
METRIC RATING
173rd/ 347
METRIC RANK
90.2%
8TH GRADE
0.0/ 100
METRIC RATING
346th/ 347
METRIC RANK
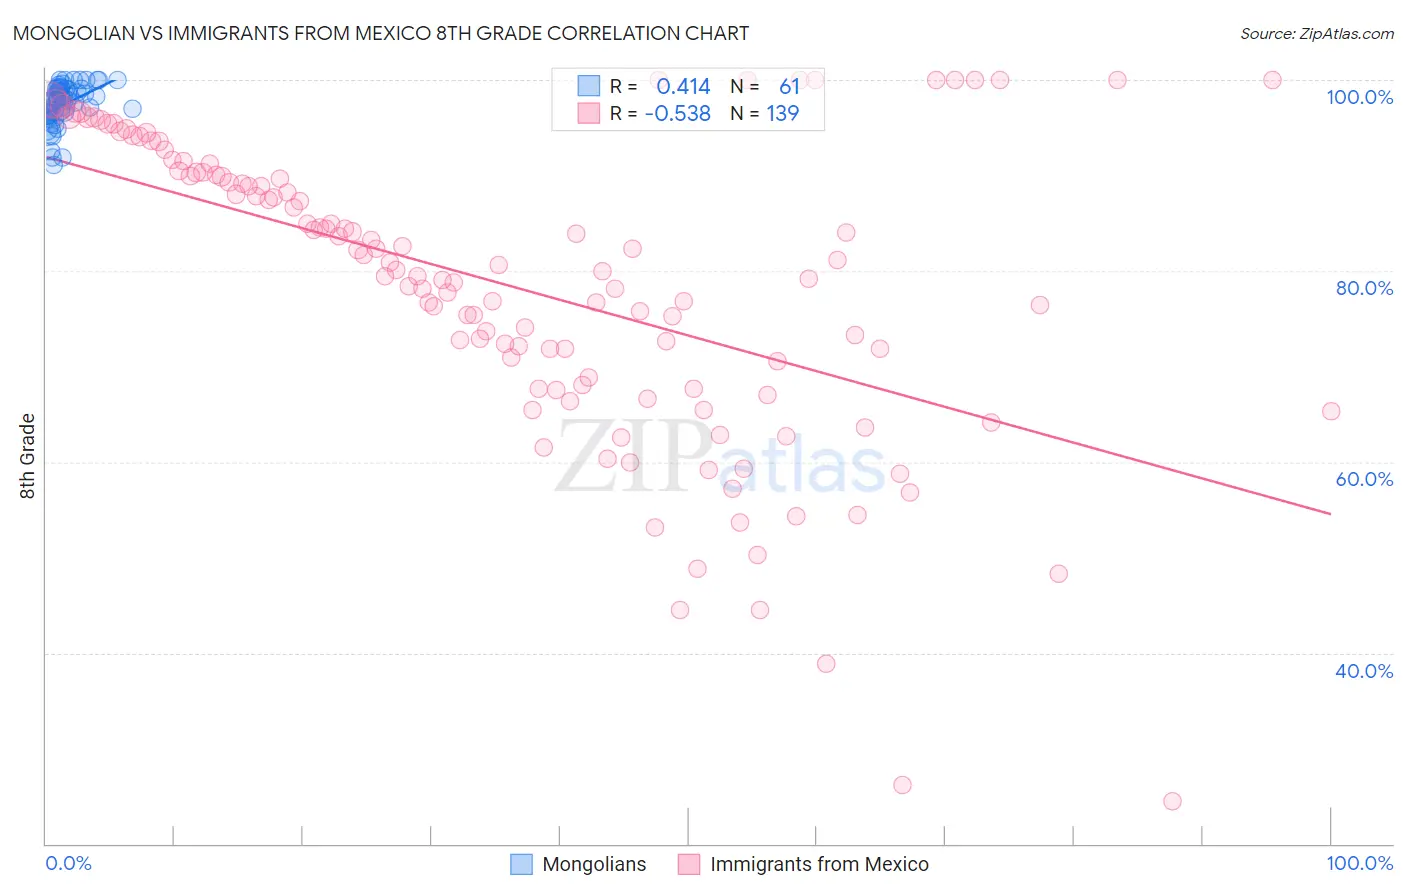
Mongolian vs Immigrants from Mexico 8th Grade Correlation Chart
The statistical analysis conducted on geographies consisting of 140,362,004 people shows a moderate positive correlation between the proportion of Mongolians and percentage of population with at least 8th grade education in the United States with a correlation coefficient (R) of 0.414 and weighted average of 95.8%. Similarly, the statistical analysis conducted on geographies consisting of 513,767,012 people shows a substantial negative correlation between the proportion of Immigrants from Mexico and percentage of population with at least 8th grade education in the United States with a correlation coefficient (R) of -0.538 and weighted average of 90.2%, a difference of 6.2%.
8th Grade Correlation Summary
| Measurement | Mongolian | Immigrants from Mexico |
| Minimum | 91.0% | 24.5% |
| Maximum | 100.0% | 100.0% |
| Range | 9.0% | 75.5% |
| Mean | 97.4% | 78.4% |
| Median | 97.9% | 80.1% |
| Interquartile 25% (IQ1) | 96.5% | 68.0% |
| Interquartile 75% (IQ3) | 99.1% | 90.3% |
| Interquartile Range (IQR) | 2.6% | 22.3% |
| Standard Deviation (Sample) | 2.1% | 15.7% |
| Standard Deviation (Population) | 2.1% | 15.6% |
Similar Demographics by 8th Grade
Demographics Similar to Mongolians by 8th Grade
In terms of 8th grade, the demographic groups most similar to Mongolians are Chilean (95.7%, a difference of 0.020%), Immigrants from Albania (95.7%, a difference of 0.020%), Egyptian (95.8%, a difference of 0.030%), Immigrants from Korea (95.8%, a difference of 0.030%), and Pakistani (95.7%, a difference of 0.030%).
| Demographics | Rating | Rank | 8th Grade |
| Immigrants | Poland | 61.1 /100 | #166 | Good 95.8% |
| Spaniards | 60.0 /100 | #167 | Good 95.8% |
| Immigrants | Ukraine | 59.5 /100 | #168 | Average 95.8% |
| Immigrants | Iran | 58.6 /100 | #169 | Average 95.8% |
| Ute | 58.5 /100 | #170 | Average 95.8% |
| Egyptians | 58.2 /100 | #171 | Average 95.8% |
| Immigrants | Korea | 57.9 /100 | #172 | Average 95.8% |
| Mongolians | 53.0 /100 | #173 | Average 95.8% |
| Chileans | 50.0 /100 | #174 | Average 95.7% |
| Immigrants | Albania | 49.6 /100 | #175 | Average 95.7% |
| Pakistanis | 48.8 /100 | #176 | Average 95.7% |
| Marshallese | 47.6 /100 | #177 | Average 95.7% |
| Venezuelans | 47.5 /100 | #178 | Average 95.7% |
| Immigrants | Brazil | 45.4 /100 | #179 | Average 95.7% |
| Iraqis | 40.5 /100 | #180 | Average 95.7% |
Demographics Similar to Immigrants from Mexico by 8th Grade
In terms of 8th grade, the demographic groups most similar to Immigrants from Mexico are Immigrants from El Salvador (90.3%, a difference of 0.18%), Immigrants from Central America (90.4%, a difference of 0.27%), Spanish American Indian (89.8%, a difference of 0.44%), Immigrants from Guatemala (90.7%, a difference of 0.64%), and Salvadoran (90.9%, a difference of 0.81%).
| Demographics | Rating | Rank | 8th Grade |
| Hispanics or Latinos | 0.0 /100 | #333 | Tragic 92.2% |
| Immigrants | Yemen | 0.0 /100 | #334 | Tragic 92.1% |
| Mexican American Indians | 0.0 /100 | #335 | Tragic 92.1% |
| Immigrants | Honduras | 0.0 /100 | #336 | Tragic 91.9% |
| Immigrants | Latin America | 0.0 /100 | #337 | Tragic 91.7% |
| Central Americans | 0.0 /100 | #338 | Tragic 91.6% |
| Mexicans | 0.0 /100 | #339 | Tragic 91.4% |
| Yakama | 0.0 /100 | #340 | Tragic 91.2% |
| Guatemalans | 0.0 /100 | #341 | Tragic 91.1% |
| Salvadorans | 0.0 /100 | #342 | Tragic 90.9% |
| Immigrants | Guatemala | 0.0 /100 | #343 | Tragic 90.7% |
| Immigrants | Central America | 0.0 /100 | #344 | Tragic 90.4% |
| Immigrants | El Salvador | 0.0 /100 | #345 | Tragic 90.3% |
| Immigrants | Mexico | 0.0 /100 | #346 | Tragic 90.2% |
| Spanish American Indians | 0.0 /100 | #347 | Tragic 89.8% |