Nonimmigrants vs Immigrants from Egypt 8th Grade
COMPARE
Nonimmigrants
Immigrants from Egypt
8th Grade
8th Grade Comparison
Nonimmigrants
Immigrants from Egypt
96.2%
8TH GRADE
96.0/ 100
METRIC RATING
116th/ 347
METRIC RANK
95.7%
8TH GRADE
37.9/ 100
METRIC RATING
182nd/ 347
METRIC RANK
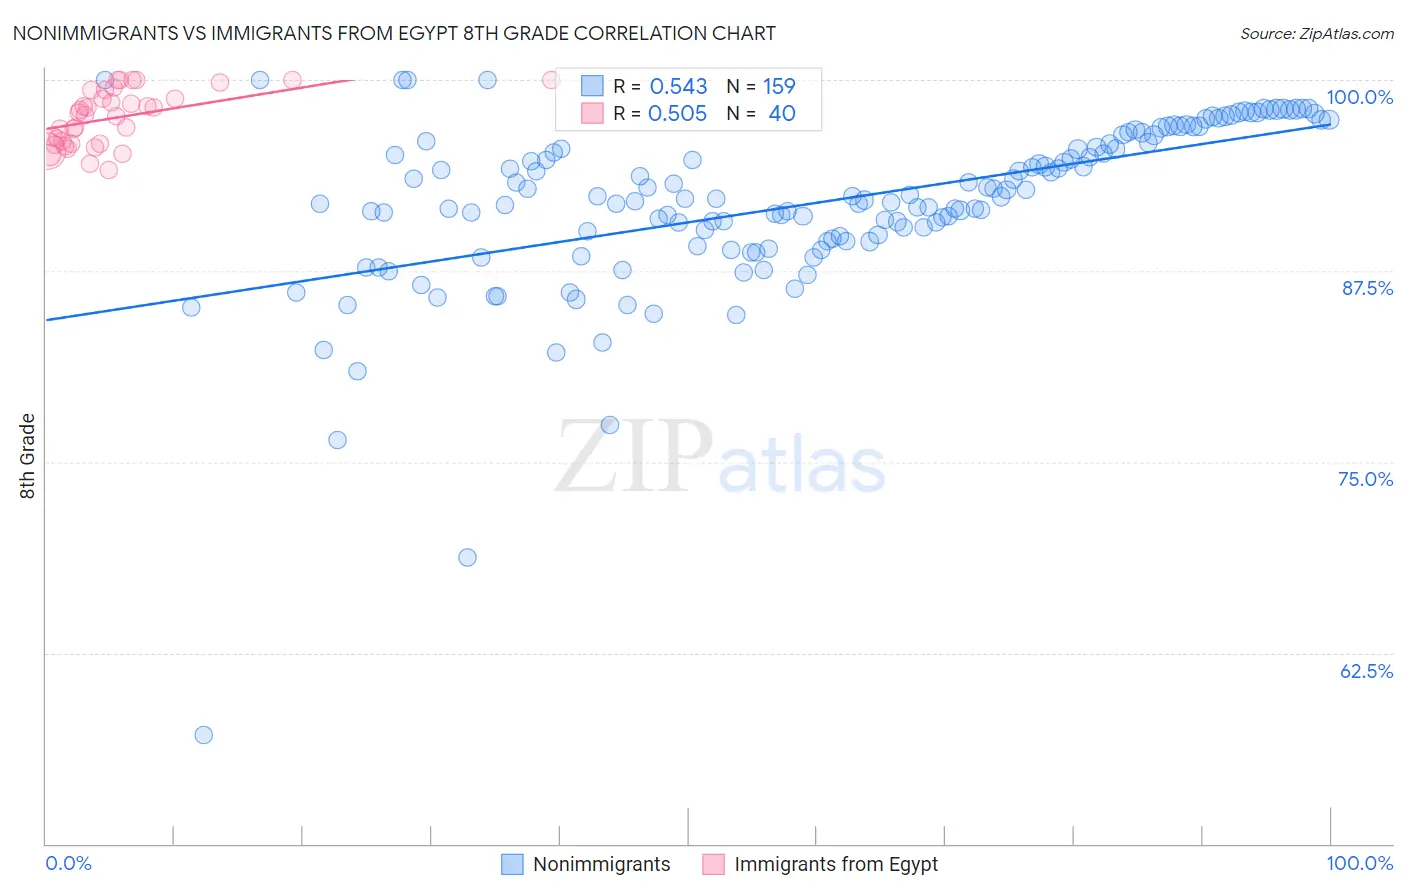
Nonimmigrants vs Immigrants from Egypt 8th Grade Correlation Chart
The statistical analysis conducted on geographies consisting of 585,374,268 people shows a substantial positive correlation between the proportion of Nonimmigrants and percentage of population with at least 8th grade education in the United States with a correlation coefficient (R) of 0.543 and weighted average of 96.2%. Similarly, the statistical analysis conducted on geographies consisting of 245,484,455 people shows a substantial positive correlation between the proportion of Immigrants from Egypt and percentage of population with at least 8th grade education in the United States with a correlation coefficient (R) of 0.505 and weighted average of 95.7%, a difference of 0.60%.
8th Grade Correlation Summary
| Measurement | Nonimmigrants | Immigrants from Egypt |
| Minimum | 57.2% | 94.1% |
| Maximum | 100.0% | 100.0% |
| Range | 42.8% | 5.9% |
| Mean | 91.9% | 97.5% |
| Median | 92.2% | 97.8% |
| Interquartile 25% (IQ1) | 89.5% | 95.8% |
| Interquartile 75% (IQ3) | 95.8% | 99.1% |
| Interquartile Range (IQR) | 6.3% | 3.2% |
| Standard Deviation (Sample) | 5.6% | 1.8% |
| Standard Deviation (Population) | 5.6% | 1.8% |
Similar Demographics by 8th Grade
Demographics Similar to Nonimmigrants by 8th Grade
In terms of 8th grade, the demographic groups most similar to Nonimmigrants are Immigrants from Croatia (96.2%, a difference of 0.0%), Immigrants from Norway (96.2%, a difference of 0.010%), Immigrants from Japan (96.2%, a difference of 0.020%), Immigrants from Moldova (96.2%, a difference of 0.020%), and Shoshone (96.3%, a difference of 0.030%).
| Demographics | Rating | Rank | 8th Grade |
| Iroquois | 97.5 /100 | #109 | Exceptional 96.3% |
| Cajuns | 97.1 /100 | #110 | Exceptional 96.3% |
| Shoshone | 96.8 /100 | #111 | Exceptional 96.3% |
| Syrians | 96.7 /100 | #112 | Exceptional 96.3% |
| Immigrants | Zimbabwe | 96.7 /100 | #113 | Exceptional 96.3% |
| Immigrants | Japan | 96.5 /100 | #114 | Exceptional 96.2% |
| Immigrants | Moldova | 96.5 /100 | #115 | Exceptional 96.2% |
| Immigrants | Nonimmigrants | 96.0 /100 | #116 | Exceptional 96.2% |
| Immigrants | Croatia | 96.0 /100 | #117 | Exceptional 96.2% |
| Immigrants | Norway | 95.7 /100 | #118 | Exceptional 96.2% |
| Immigrants | Switzerland | 95.3 /100 | #119 | Exceptional 96.2% |
| Immigrants | France | 95.3 /100 | #120 | Exceptional 96.2% |
| Immigrants | Bulgaria | 95.3 /100 | #121 | Exceptional 96.2% |
| Immigrants | Europe | 95.3 /100 | #122 | Exceptional 96.2% |
| Filipinos | 94.6 /100 | #123 | Exceptional 96.2% |
Demographics Similar to Immigrants from Egypt by 8th Grade
In terms of 8th grade, the demographic groups most similar to Immigrants from Egypt are Immigrants from Spain (95.7%, a difference of 0.010%), Immigrants from Iraq (95.6%, a difference of 0.010%), Immigrants from Uganda (95.6%, a difference of 0.010%), Iraqi (95.7%, a difference of 0.020%), and Black/African American (95.6%, a difference of 0.020%).
| Demographics | Rating | Rank | 8th Grade |
| Immigrants | Albania | 49.6 /100 | #175 | Average 95.7% |
| Pakistanis | 48.8 /100 | #176 | Average 95.7% |
| Marshallese | 47.6 /100 | #177 | Average 95.7% |
| Venezuelans | 47.5 /100 | #178 | Average 95.7% |
| Immigrants | Brazil | 45.4 /100 | #179 | Average 95.7% |
| Iraqis | 40.5 /100 | #180 | Average 95.7% |
| Immigrants | Spain | 38.7 /100 | #181 | Fair 95.7% |
| Immigrants | Egypt | 37.9 /100 | #182 | Fair 95.7% |
| Immigrants | Iraq | 36.2 /100 | #183 | Fair 95.6% |
| Immigrants | Uganda | 36.0 /100 | #184 | Fair 95.6% |
| Blacks/African Americans | 34.8 /100 | #185 | Fair 95.6% |
| Brazilians | 34.8 /100 | #186 | Fair 95.6% |
| Sudanese | 33.0 /100 | #187 | Fair 95.6% |
| Liberians | 32.4 /100 | #188 | Fair 95.6% |
| Immigrants | Micronesia | 31.6 /100 | #189 | Fair 95.6% |