Costa Rican vs Immigrants from Egypt 8th Grade
COMPARE
Costa Rican
Immigrants from Egypt
8th Grade
8th Grade Comparison
Costa Ricans
Immigrants from Egypt
95.2%
8TH GRADE
3.0/ 100
METRIC RATING
234th/ 347
METRIC RANK
95.7%
8TH GRADE
37.9/ 100
METRIC RATING
182nd/ 347
METRIC RANK
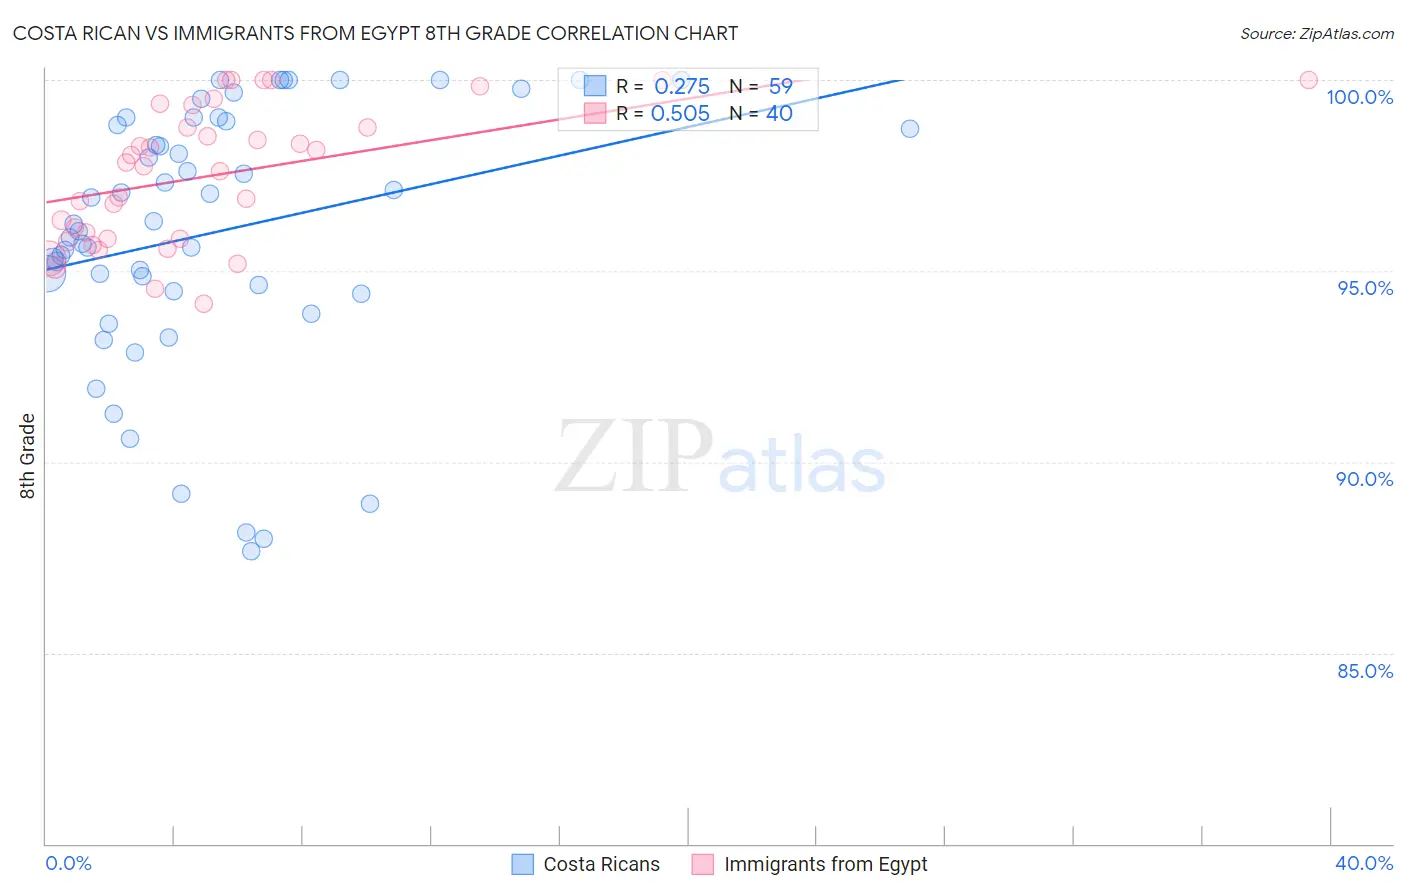
Costa Rican vs Immigrants from Egypt 8th Grade Correlation Chart
The statistical analysis conducted on geographies consisting of 253,601,897 people shows a weak positive correlation between the proportion of Costa Ricans and percentage of population with at least 8th grade education in the United States with a correlation coefficient (R) of 0.275 and weighted average of 95.2%. Similarly, the statistical analysis conducted on geographies consisting of 245,484,455 people shows a substantial positive correlation between the proportion of Immigrants from Egypt and percentage of population with at least 8th grade education in the United States with a correlation coefficient (R) of 0.505 and weighted average of 95.7%, a difference of 0.48%.
8th Grade Correlation Summary
| Measurement | Costa Rican | Immigrants from Egypt |
| Minimum | 87.6% | 94.1% |
| Maximum | 100.0% | 100.0% |
| Range | 12.4% | 5.9% |
| Mean | 96.0% | 97.5% |
| Median | 96.2% | 97.8% |
| Interquartile 25% (IQ1) | 94.5% | 95.8% |
| Interquartile 75% (IQ3) | 98.9% | 99.1% |
| Interquartile Range (IQR) | 4.5% | 3.2% |
| Standard Deviation (Sample) | 3.4% | 1.8% |
| Standard Deviation (Population) | 3.3% | 1.8% |
Similar Demographics by 8th Grade
Demographics Similar to Costa Ricans by 8th Grade
In terms of 8th grade, the demographic groups most similar to Costa Ricans are Immigrants from Asia (95.2%, a difference of 0.0%), Nigerian (95.2%, a difference of 0.010%), Asian (95.2%, a difference of 0.020%), Indian (Asian) (95.2%, a difference of 0.020%), and Senegalese (95.2%, a difference of 0.020%).
| Demographics | Rating | Rank | 8th Grade |
| Bahamians | 5.6 /100 | #227 | Tragic 95.3% |
| Immigrants | Eastern Africa | 5.6 /100 | #228 | Tragic 95.3% |
| Immigrants | Indonesia | 4.4 /100 | #229 | Tragic 95.3% |
| Immigrants | Panama | 4.1 /100 | #230 | Tragic 95.2% |
| Asians | 3.5 /100 | #231 | Tragic 95.2% |
| Indians (Asian) | 3.3 /100 | #232 | Tragic 95.2% |
| Immigrants | Asia | 3.1 /100 | #233 | Tragic 95.2% |
| Costa Ricans | 3.0 /100 | #234 | Tragic 95.2% |
| Nigerians | 2.9 /100 | #235 | Tragic 95.2% |
| Senegalese | 2.7 /100 | #236 | Tragic 95.2% |
| Immigrants | Africa | 2.7 /100 | #237 | Tragic 95.2% |
| Natives/Alaskans | 2.3 /100 | #238 | Tragic 95.2% |
| Immigrants | Sierra Leone | 2.1 /100 | #239 | Tragic 95.1% |
| Ethiopians | 2.0 /100 | #240 | Tragic 95.1% |
| South American Indians | 1.9 /100 | #241 | Tragic 95.1% |
Demographics Similar to Immigrants from Egypt by 8th Grade
In terms of 8th grade, the demographic groups most similar to Immigrants from Egypt are Immigrants from Spain (95.7%, a difference of 0.010%), Immigrants from Iraq (95.6%, a difference of 0.010%), Immigrants from Uganda (95.6%, a difference of 0.010%), Iraqi (95.7%, a difference of 0.020%), and Black/African American (95.6%, a difference of 0.020%).
| Demographics | Rating | Rank | 8th Grade |
| Immigrants | Albania | 49.6 /100 | #175 | Average 95.7% |
| Pakistanis | 48.8 /100 | #176 | Average 95.7% |
| Marshallese | 47.6 /100 | #177 | Average 95.7% |
| Venezuelans | 47.5 /100 | #178 | Average 95.7% |
| Immigrants | Brazil | 45.4 /100 | #179 | Average 95.7% |
| Iraqis | 40.5 /100 | #180 | Average 95.7% |
| Immigrants | Spain | 38.7 /100 | #181 | Fair 95.7% |
| Immigrants | Egypt | 37.9 /100 | #182 | Fair 95.7% |
| Immigrants | Iraq | 36.2 /100 | #183 | Fair 95.6% |
| Immigrants | Uganda | 36.0 /100 | #184 | Fair 95.6% |
| Blacks/African Americans | 34.8 /100 | #185 | Fair 95.6% |
| Brazilians | 34.8 /100 | #186 | Fair 95.6% |
| Sudanese | 33.0 /100 | #187 | Fair 95.6% |
| Liberians | 32.4 /100 | #188 | Fair 95.6% |
| Immigrants | Micronesia | 31.6 /100 | #189 | Fair 95.6% |