Belgian vs Immigrants from Egypt 8th Grade
COMPARE
Belgian
Immigrants from Egypt
8th Grade
8th Grade Comparison
Belgians
Immigrants from Egypt
97.0%
8TH GRADE
100.0/ 100
METRIC RATING
36th/ 347
METRIC RANK
95.7%
8TH GRADE
37.9/ 100
METRIC RATING
182nd/ 347
METRIC RANK
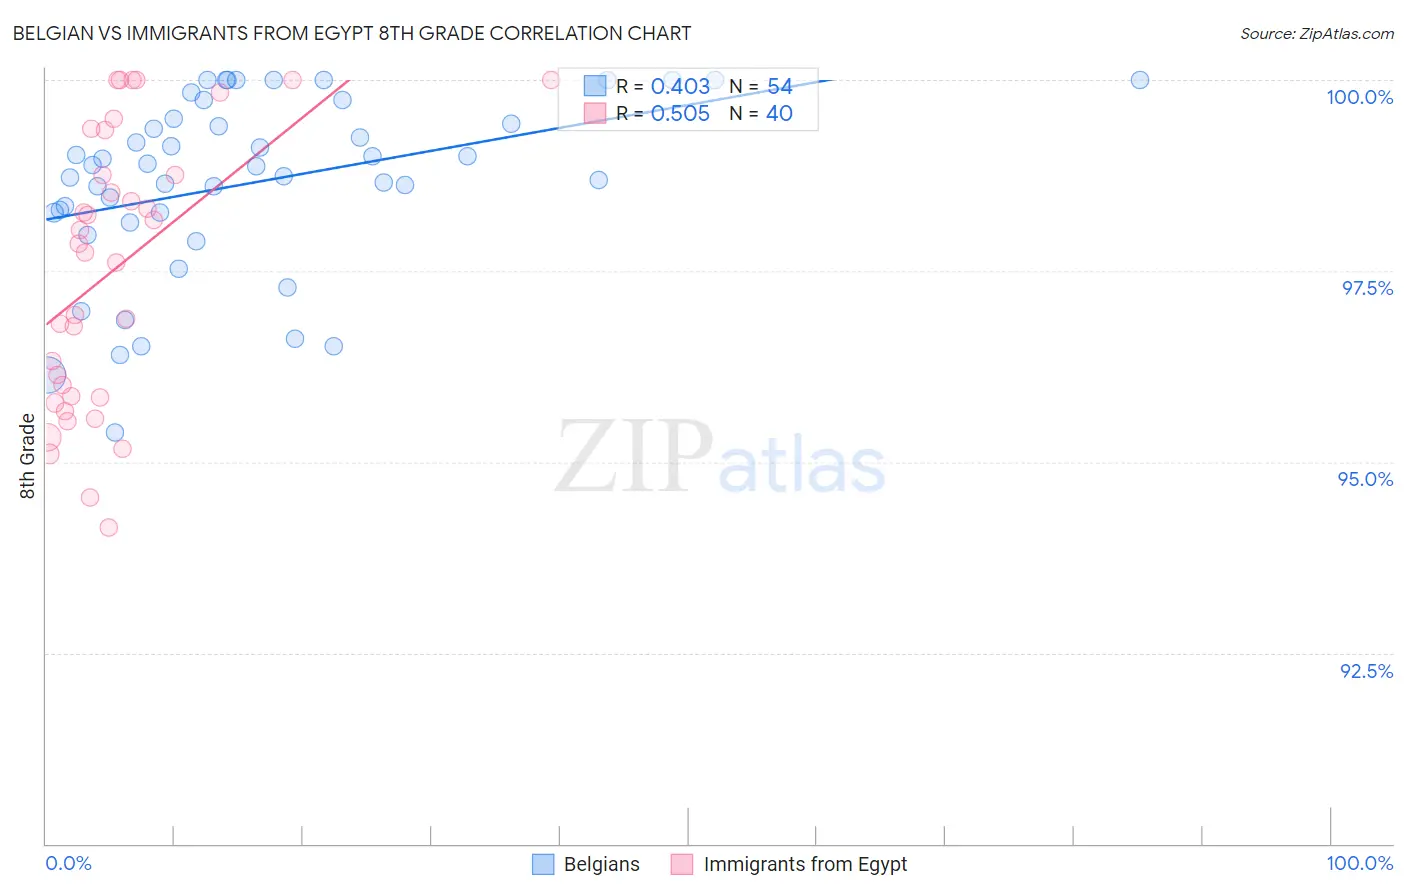
Belgian vs Immigrants from Egypt 8th Grade Correlation Chart
The statistical analysis conducted on geographies consisting of 356,016,627 people shows a moderate positive correlation between the proportion of Belgians and percentage of population with at least 8th grade education in the United States with a correlation coefficient (R) of 0.403 and weighted average of 97.0%. Similarly, the statistical analysis conducted on geographies consisting of 245,484,455 people shows a substantial positive correlation between the proportion of Immigrants from Egypt and percentage of population with at least 8th grade education in the United States with a correlation coefficient (R) of 0.505 and weighted average of 95.7%, a difference of 1.4%.
8th Grade Correlation Summary
| Measurement | Belgian | Immigrants from Egypt |
| Minimum | 95.4% | 94.1% |
| Maximum | 100.0% | 100.0% |
| Range | 4.6% | 5.9% |
| Mean | 98.7% | 97.5% |
| Median | 98.9% | 97.8% |
| Interquartile 25% (IQ1) | 98.3% | 95.8% |
| Interquartile 75% (IQ3) | 99.5% | 99.1% |
| Interquartile Range (IQR) | 1.2% | 3.2% |
| Standard Deviation (Sample) | 1.2% | 1.8% |
| Standard Deviation (Population) | 1.2% | 1.8% |
Similar Demographics by 8th Grade
Demographics Similar to Belgians by 8th Grade
In terms of 8th grade, the demographic groups most similar to Belgians are Latvian (97.0%, a difference of 0.0%), Alaska Native (97.0%, a difference of 0.010%), Luxembourger (97.0%, a difference of 0.020%), British (97.0%, a difference of 0.020%), and Hungarian (97.0%, a difference of 0.020%).
| Demographics | Rating | Rank | 8th Grade |
| Europeans | 100.0 /100 | #29 | Exceptional 97.1% |
| Sioux | 100.0 /100 | #30 | Exceptional 97.1% |
| Chippewa | 100.0 /100 | #31 | Exceptional 97.1% |
| Yup'ik | 100.0 /100 | #32 | Exceptional 97.0% |
| Swiss | 100.0 /100 | #33 | Exceptional 97.0% |
| Luxembourgers | 100.0 /100 | #34 | Exceptional 97.0% |
| Alaska Natives | 100.0 /100 | #35 | Exceptional 97.0% |
| Belgians | 100.0 /100 | #36 | Exceptional 97.0% |
| Latvians | 100.0 /100 | #37 | Exceptional 97.0% |
| British | 100.0 /100 | #38 | Exceptional 97.0% |
| Hungarians | 100.0 /100 | #39 | Exceptional 97.0% |
| Inupiat | 100.0 /100 | #40 | Exceptional 97.0% |
| Eastern Europeans | 100.0 /100 | #41 | Exceptional 97.0% |
| Chinese | 100.0 /100 | #42 | Exceptional 96.9% |
| Aleuts | 99.9 /100 | #43 | Exceptional 96.9% |
Demographics Similar to Immigrants from Egypt by 8th Grade
In terms of 8th grade, the demographic groups most similar to Immigrants from Egypt are Immigrants from Spain (95.7%, a difference of 0.010%), Immigrants from Iraq (95.6%, a difference of 0.010%), Immigrants from Uganda (95.6%, a difference of 0.010%), Iraqi (95.7%, a difference of 0.020%), and Black/African American (95.6%, a difference of 0.020%).
| Demographics | Rating | Rank | 8th Grade |
| Immigrants | Albania | 49.6 /100 | #175 | Average 95.7% |
| Pakistanis | 48.8 /100 | #176 | Average 95.7% |
| Marshallese | 47.6 /100 | #177 | Average 95.7% |
| Venezuelans | 47.5 /100 | #178 | Average 95.7% |
| Immigrants | Brazil | 45.4 /100 | #179 | Average 95.7% |
| Iraqis | 40.5 /100 | #180 | Average 95.7% |
| Immigrants | Spain | 38.7 /100 | #181 | Fair 95.7% |
| Immigrants | Egypt | 37.9 /100 | #182 | Fair 95.7% |
| Immigrants | Iraq | 36.2 /100 | #183 | Fair 95.6% |
| Immigrants | Uganda | 36.0 /100 | #184 | Fair 95.6% |
| Blacks/African Americans | 34.8 /100 | #185 | Fair 95.6% |
| Brazilians | 34.8 /100 | #186 | Fair 95.6% |
| Sudanese | 33.0 /100 | #187 | Fair 95.6% |
| Liberians | 32.4 /100 | #188 | Fair 95.6% |
| Immigrants | Micronesia | 31.6 /100 | #189 | Fair 95.6% |