Cree vs Immigrants from Dominican Republic 10th Grade
COMPARE
Cree
Immigrants from Dominican Republic
10th Grade
10th Grade Comparison
Cree
Immigrants from Dominican Republic
94.4%
10TH GRADE
95.1/ 100
METRIC RATING
123rd/ 347
METRIC RANK
88.7%
10TH GRADE
0.0/ 100
METRIC RATING
335th/ 347
METRIC RANK
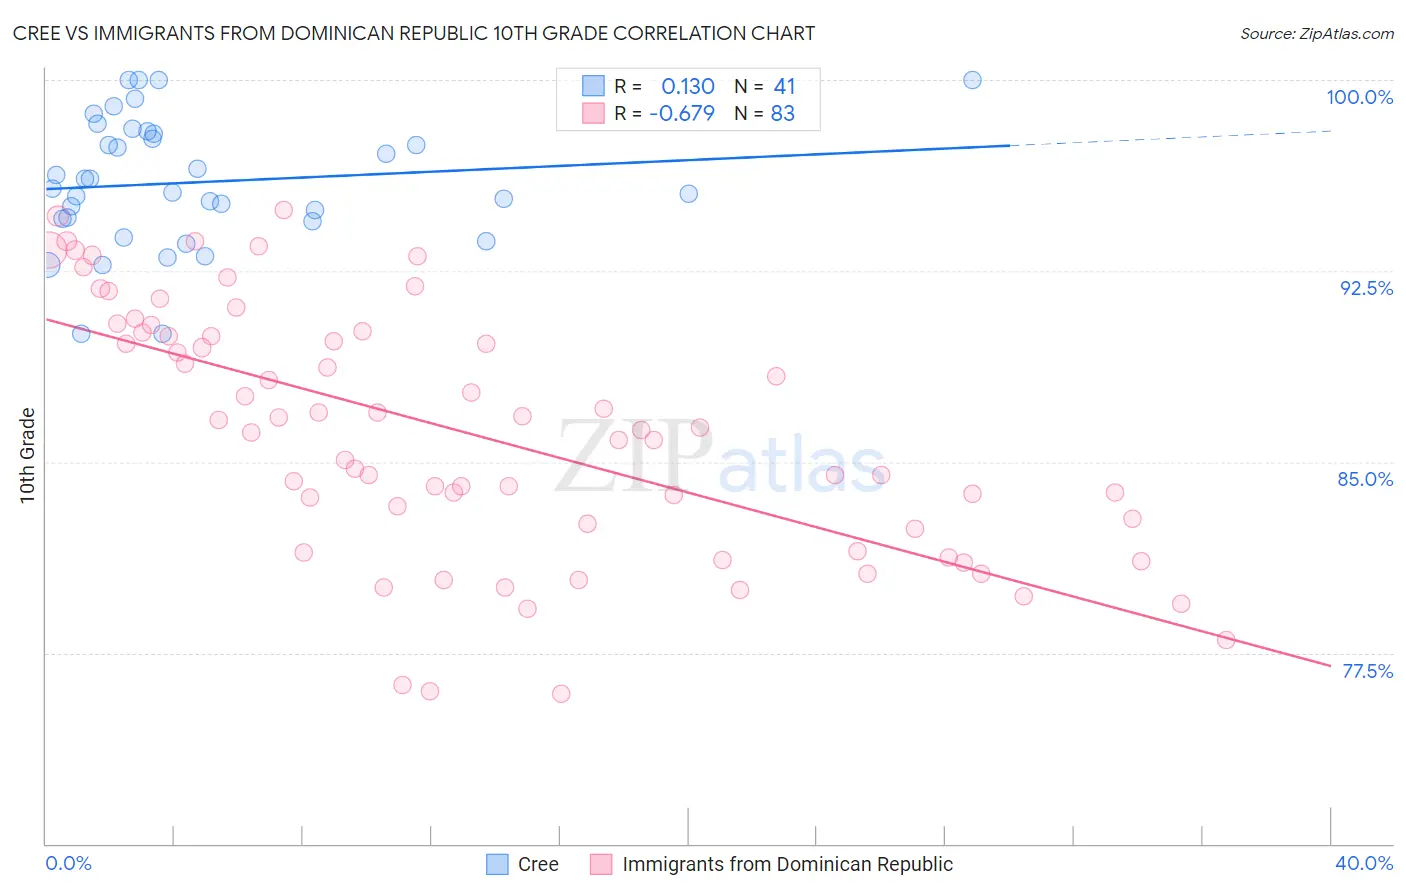
Cree vs Immigrants from Dominican Republic 10th Grade Correlation Chart
The statistical analysis conducted on geographies consisting of 76,211,744 people shows a poor positive correlation between the proportion of Cree and percentage of population with at least 10th grade education in the United States with a correlation coefficient (R) of 0.130 and weighted average of 94.4%. Similarly, the statistical analysis conducted on geographies consisting of 275,144,349 people shows a significant negative correlation between the proportion of Immigrants from Dominican Republic and percentage of population with at least 10th grade education in the United States with a correlation coefficient (R) of -0.679 and weighted average of 88.7%, a difference of 6.4%.
10th Grade Correlation Summary
| Measurement | Cree | Immigrants from Dominican Republic |
| Minimum | 90.0% | 75.9% |
| Maximum | 100.0% | 94.9% |
| Range | 10.0% | 19.0% |
| Mean | 96.0% | 86.1% |
| Median | 95.7% | 86.3% |
| Interquartile 25% (IQ1) | 94.5% | 82.4% |
| Interquartile 75% (IQ3) | 97.9% | 90.1% |
| Interquartile Range (IQR) | 3.4% | 7.7% |
| Standard Deviation (Sample) | 2.5% | 4.9% |
| Standard Deviation (Population) | 2.5% | 4.8% |
Similar Demographics by 10th Grade
Demographics Similar to Cree by 10th Grade
In terms of 10th grade, the demographic groups most similar to Cree are Immigrants from Belarus (94.4%, a difference of 0.0%), Inupiat (94.4%, a difference of 0.0%), Immigrants from Taiwan (94.4%, a difference of 0.010%), Basque (94.3%, a difference of 0.010%), and Jordanian (94.4%, a difference of 0.020%).
| Demographics | Rating | Rank | 10th Grade |
| Sioux | 96.2 /100 | #116 | Exceptional 94.4% |
| Immigrants | Hungary | 95.8 /100 | #117 | Exceptional 94.4% |
| Jordanians | 95.6 /100 | #118 | Exceptional 94.4% |
| Immigrants | Israel | 95.4 /100 | #119 | Exceptional 94.4% |
| Immigrants | Taiwan | 95.3 /100 | #120 | Exceptional 94.4% |
| Immigrants | Belarus | 95.2 /100 | #121 | Exceptional 94.4% |
| Inupiat | 95.1 /100 | #122 | Exceptional 94.4% |
| Cree | 95.1 /100 | #123 | Exceptional 94.4% |
| Basques | 94.9 /100 | #124 | Exceptional 94.3% |
| Americans | 94.4 /100 | #125 | Exceptional 94.3% |
| Immigrants | Iran | 94.4 /100 | #126 | Exceptional 94.3% |
| Israelis | 93.8 /100 | #127 | Exceptional 94.3% |
| Potawatomi | 93.6 /100 | #128 | Exceptional 94.3% |
| Iroquois | 92.8 /100 | #129 | Exceptional 94.3% |
| Immigrants | Greece | 92.7 /100 | #130 | Exceptional 94.3% |
Demographics Similar to Immigrants from Dominican Republic by 10th Grade
In terms of 10th grade, the demographic groups most similar to Immigrants from Dominican Republic are Hispanic or Latino (88.9%, a difference of 0.18%), Immigrants from Honduras (88.5%, a difference of 0.19%), Honduran (89.0%, a difference of 0.30%), Immigrants from the Azores (89.0%, a difference of 0.33%), and Central American (88.4%, a difference of 0.35%).
| Demographics | Rating | Rank | 10th Grade |
| Immigrants | Cabo Verde | 0.0 /100 | #328 | Tragic 89.5% |
| Dominicans | 0.0 /100 | #329 | Tragic 89.4% |
| Immigrants | Yemen | 0.0 /100 | #330 | Tragic 89.1% |
| Mexican American Indians | 0.0 /100 | #331 | Tragic 89.0% |
| Immigrants | Azores | 0.0 /100 | #332 | Tragic 89.0% |
| Hondurans | 0.0 /100 | #333 | Tragic 89.0% |
| Hispanics or Latinos | 0.0 /100 | #334 | Tragic 88.9% |
| Immigrants | Dominican Republic | 0.0 /100 | #335 | Tragic 88.7% |
| Immigrants | Honduras | 0.0 /100 | #336 | Tragic 88.5% |
| Central Americans | 0.0 /100 | #337 | Tragic 88.4% |
| Immigrants | Latin America | 0.0 /100 | #338 | Tragic 88.3% |
| Guatemalans | 0.0 /100 | #339 | Tragic 87.9% |
| Mexicans | 0.0 /100 | #340 | Tragic 87.8% |
| Salvadorans | 0.0 /100 | #341 | Tragic 87.5% |
| Immigrants | Guatemala | 0.0 /100 | #342 | Tragic 87.4% |