Mexican vs Immigrants from South America Associate's Degree
COMPARE
Mexican
Immigrants from South America
Associate's Degree
Associate's Degree Comparison
Mexicans
Immigrants from South America
35.0%
ASSOCIATE'S DEGREE
0.0/ 100
METRIC RATING
333rd/ 347
METRIC RANK
46.7%
ASSOCIATE'S DEGREE
59.9/ 100
METRIC RATING
165th/ 347
METRIC RANK
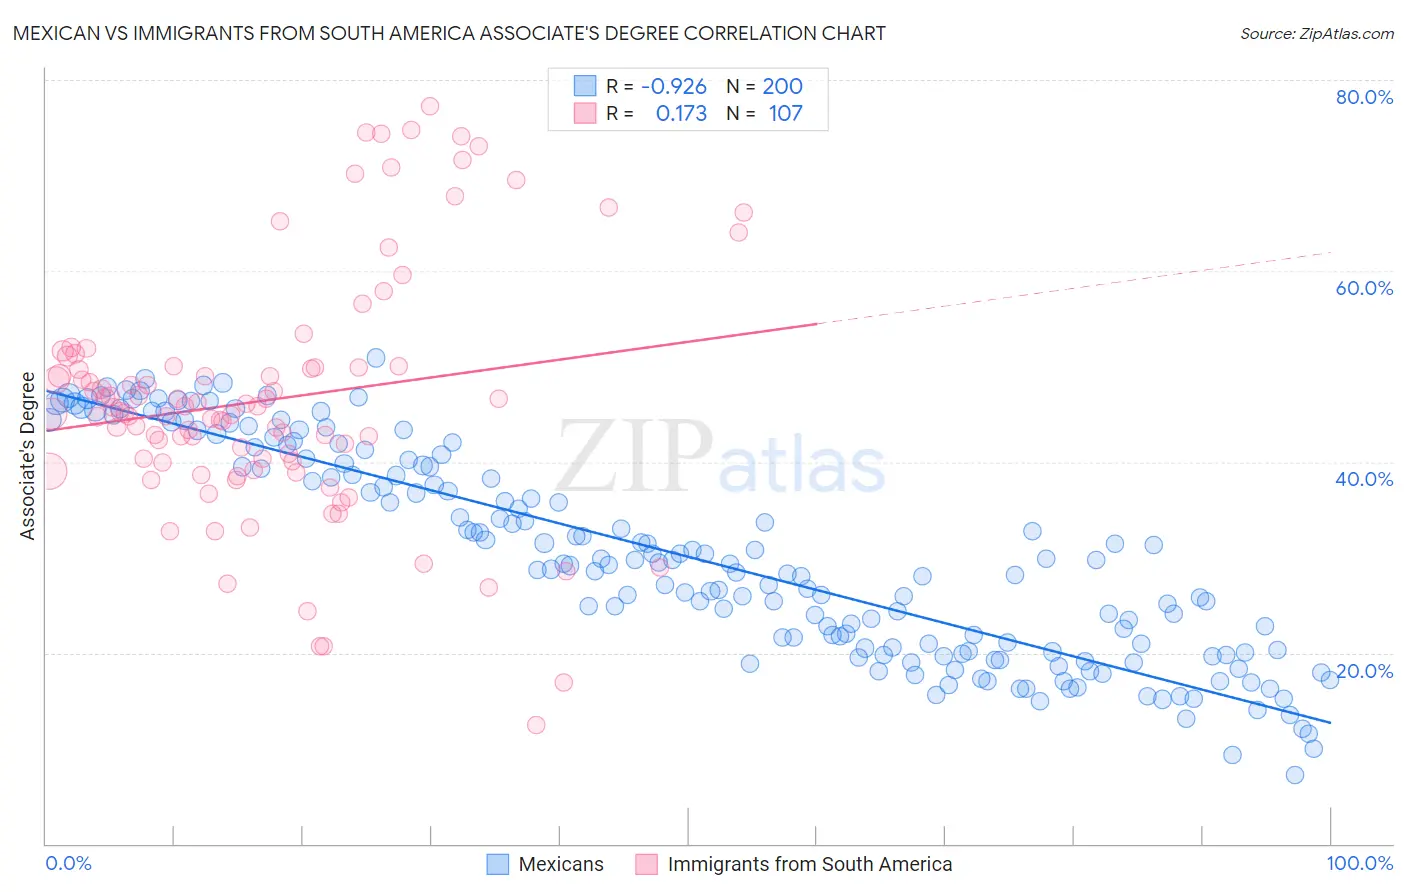
Mexican vs Immigrants from South America Associate's Degree Correlation Chart
The statistical analysis conducted on geographies consisting of 565,203,819 people shows a near-perfect negative correlation between the proportion of Mexicans and percentage of population with at least associate's degree education in the United States with a correlation coefficient (R) of -0.926 and weighted average of 35.0%. Similarly, the statistical analysis conducted on geographies consisting of 486,384,317 people shows a poor positive correlation between the proportion of Immigrants from South America and percentage of population with at least associate's degree education in the United States with a correlation coefficient (R) of 0.173 and weighted average of 46.7%, a difference of 33.5%.
Associate's Degree Correlation Summary
| Measurement | Mexican | Immigrants from South America |
| Minimum | 7.3% | 12.4% |
| Maximum | 50.9% | 77.3% |
| Range | 43.6% | 64.9% |
| Mean | 30.0% | 46.5% |
| Median | 29.3% | 45.2% |
| Interquartile 25% (IQ1) | 20.2% | 40.0% |
| Interquartile 75% (IQ3) | 39.7% | 50.0% |
| Interquartile Range (IQR) | 19.5% | 10.0% |
| Standard Deviation (Sample) | 10.9% | 12.9% |
| Standard Deviation (Population) | 10.9% | 12.8% |
Similar Demographics by Associate's Degree
Demographics Similar to Mexicans by Associate's Degree
In terms of associate's degree, the demographic groups most similar to Mexicans are Immigrants from Central America (35.0%, a difference of 0.080%), Native/Alaskan (34.9%, a difference of 0.24%), Spanish American Indian (34.9%, a difference of 0.37%), Hopi (34.6%, a difference of 1.3%), and Immigrants from the Azores (35.6%, a difference of 1.9%).
| Demographics | Rating | Rank | Associate's Degree |
| Kiowa | 0.0 /100 | #326 | Tragic 36.5% |
| Dutch West Indians | 0.0 /100 | #327 | Tragic 36.5% |
| Alaskan Athabascans | 0.0 /100 | #328 | Tragic 36.5% |
| Paiute | 0.0 /100 | #329 | Tragic 36.4% |
| Apache | 0.0 /100 | #330 | Tragic 36.2% |
| Immigrants | Azores | 0.0 /100 | #331 | Tragic 35.6% |
| Immigrants | Central America | 0.0 /100 | #332 | Tragic 35.0% |
| Mexicans | 0.0 /100 | #333 | Tragic 35.0% |
| Natives/Alaskans | 0.0 /100 | #334 | Tragic 34.9% |
| Spanish American Indians | 0.0 /100 | #335 | Tragic 34.9% |
| Hopi | 0.0 /100 | #336 | Tragic 34.6% |
| Lumbee | 0.0 /100 | #337 | Tragic 34.1% |
| Pueblo | 0.0 /100 | #338 | Tragic 34.0% |
| Immigrants | Mexico | 0.0 /100 | #339 | Tragic 33.7% |
| Navajo | 0.0 /100 | #340 | Tragic 32.6% |
Demographics Similar to Immigrants from South America by Associate's Degree
In terms of associate's degree, the demographic groups most similar to Immigrants from South America are Hungarian (46.7%, a difference of 0.040%), Immigrants from Sierra Leone (46.7%, a difference of 0.050%), Colombian (46.8%, a difference of 0.20%), Somali (46.8%, a difference of 0.21%), and Immigrants from Africa (46.8%, a difference of 0.26%).
| Demographics | Rating | Rank | Associate's Degree |
| Immigrants | Germany | 69.7 /100 | #158 | Good 47.1% |
| Immigrants | Poland | 69.2 /100 | #159 | Good 47.1% |
| Scottish | 65.4 /100 | #160 | Good 46.9% |
| Scandinavians | 65.2 /100 | #161 | Good 46.9% |
| Immigrants | Africa | 63.2 /100 | #162 | Good 46.8% |
| Somalis | 62.5 /100 | #163 | Good 46.8% |
| Colombians | 62.4 /100 | #164 | Good 46.8% |
| Immigrants | South America | 59.9 /100 | #165 | Average 46.7% |
| Hungarians | 59.3 /100 | #166 | Average 46.7% |
| Immigrants | Sierra Leone | 59.2 /100 | #167 | Average 46.7% |
| Immigrants | Somalia | 55.5 /100 | #168 | Average 46.5% |
| Uruguayans | 55.4 /100 | #169 | Average 46.5% |
| Irish | 53.6 /100 | #170 | Average 46.5% |
| Basques | 52.8 /100 | #171 | Average 46.5% |
| Peruvians | 50.5 /100 | #172 | Average 46.4% |