Mexican American Indian vs New Zealander Master's Degree
COMPARE
Mexican American Indian
New Zealander
Master's Degree
Master's Degree Comparison
Mexican American Indians
New Zealanders
11.2%
MASTER'S DEGREE
0.0/ 100
METRIC RATING
306th/ 347
METRIC RANK
18.3%
MASTER'S DEGREE
99.9/ 100
METRIC RATING
60th/ 347
METRIC RANK
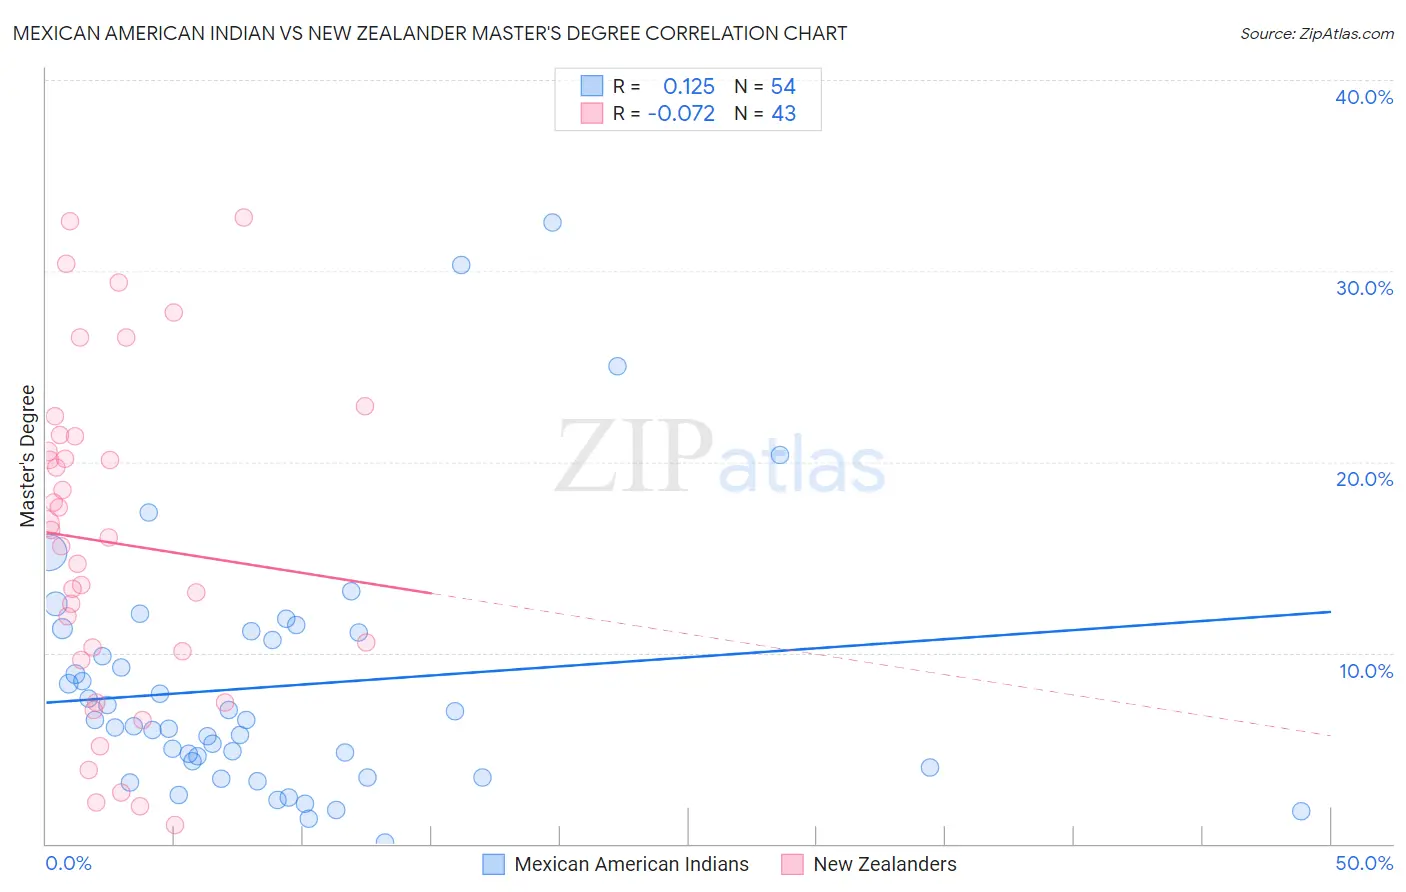
Mexican American Indian vs New Zealander Master's Degree Correlation Chart
The statistical analysis conducted on geographies consisting of 317,480,404 people shows a poor positive correlation between the proportion of Mexican American Indians and percentage of population with at least master's degree education in the United States with a correlation coefficient (R) of 0.125 and weighted average of 11.2%. Similarly, the statistical analysis conducted on geographies consisting of 106,899,684 people shows a slight negative correlation between the proportion of New Zealanders and percentage of population with at least master's degree education in the United States with a correlation coefficient (R) of -0.072 and weighted average of 18.3%, a difference of 62.5%.
Master's Degree Correlation Summary
| Measurement | Mexican American Indian | New Zealander |
| Minimum | 0.093% | 1.0% |
| Maximum | 32.5% | 32.8% |
| Range | 32.4% | 31.8% |
| Mean | 8.2% | 15.8% |
| Median | 6.3% | 16.0% |
| Interquartile 25% (IQ1) | 4.0% | 9.6% |
| Interquartile 75% (IQ3) | 11.1% | 21.3% |
| Interquartile Range (IQR) | 7.1% | 11.7% |
| Standard Deviation (Sample) | 6.7% | 8.6% |
| Standard Deviation (Population) | 6.6% | 8.5% |
Similar Demographics by Master's Degree
Demographics Similar to Mexican American Indians by Master's Degree
In terms of master's degree, the demographic groups most similar to Mexican American Indians are Cheyenne (11.2%, a difference of 0.15%), Immigrants from Latin America (11.3%, a difference of 0.19%), Puerto Rican (11.2%, a difference of 0.70%), Immigrants from Cabo Verde (11.3%, a difference of 0.84%), and Puget Sound Salish (11.1%, a difference of 0.99%).
| Demographics | Rating | Rank | Master's Degree |
| Chickasaw | 0.1 /100 | #299 | Tragic 11.4% |
| Chippewa | 0.1 /100 | #300 | Tragic 11.4% |
| Tsimshian | 0.1 /100 | #301 | Tragic 11.4% |
| Cherokee | 0.1 /100 | #302 | Tragic 11.4% |
| Immigrants | Laos | 0.1 /100 | #303 | Tragic 11.4% |
| Immigrants | Cabo Verde | 0.1 /100 | #304 | Tragic 11.3% |
| Immigrants | Latin America | 0.0 /100 | #305 | Tragic 11.3% |
| Mexican American Indians | 0.0 /100 | #306 | Tragic 11.2% |
| Cheyenne | 0.0 /100 | #307 | Tragic 11.2% |
| Puerto Ricans | 0.0 /100 | #308 | Tragic 11.2% |
| Puget Sound Salish | 0.0 /100 | #309 | Tragic 11.1% |
| Shoshone | 0.0 /100 | #310 | Tragic 11.1% |
| Seminole | 0.0 /100 | #311 | Tragic 11.0% |
| Choctaw | 0.0 /100 | #312 | Tragic 11.0% |
| Yaqui | 0.0 /100 | #313 | Tragic 11.0% |
Demographics Similar to New Zealanders by Master's Degree
In terms of master's degree, the demographic groups most similar to New Zealanders are Immigrants from Europe (18.2%, a difference of 0.15%), Immigrants from Bulgaria (18.3%, a difference of 0.23%), Argentinean (18.2%, a difference of 0.51%), Australian (18.4%, a difference of 0.66%), and Immigrants from Asia (18.4%, a difference of 0.80%).
| Demographics | Rating | Rank | Master's Degree |
| Immigrants | Czechoslovakia | 99.9 /100 | #53 | Exceptional 18.5% |
| Immigrants | Lithuania | 99.9 /100 | #54 | Exceptional 18.5% |
| Immigrants | Serbia | 99.9 /100 | #55 | Exceptional 18.5% |
| Asians | 99.9 /100 | #56 | Exceptional 18.4% |
| Immigrants | Asia | 99.9 /100 | #57 | Exceptional 18.4% |
| Australians | 99.9 /100 | #58 | Exceptional 18.4% |
| Immigrants | Bulgaria | 99.9 /100 | #59 | Exceptional 18.3% |
| New Zealanders | 99.9 /100 | #60 | Exceptional 18.3% |
| Immigrants | Europe | 99.9 /100 | #61 | Exceptional 18.2% |
| Argentineans | 99.9 /100 | #62 | Exceptional 18.2% |
| Immigrants | Netherlands | 99.9 /100 | #63 | Exceptional 18.1% |
| South Africans | 99.9 /100 | #64 | Exceptional 18.1% |
| Immigrants | Kazakhstan | 99.8 /100 | #65 | Exceptional 18.0% |
| Ethiopians | 99.8 /100 | #66 | Exceptional 18.0% |
| Immigrants | Argentina | 99.8 /100 | #67 | Exceptional 18.0% |