Immigrants from Singapore vs New Zealander Master's Degree
COMPARE
Immigrants from Singapore
New Zealander
Master's Degree
Master's Degree Comparison
Immigrants from Singapore
New Zealanders
23.4%
MASTER'S DEGREE
100.0/ 100
METRIC RATING
1st/ 347
METRIC RANK
18.3%
MASTER'S DEGREE
99.9/ 100
METRIC RATING
60th/ 347
METRIC RANK
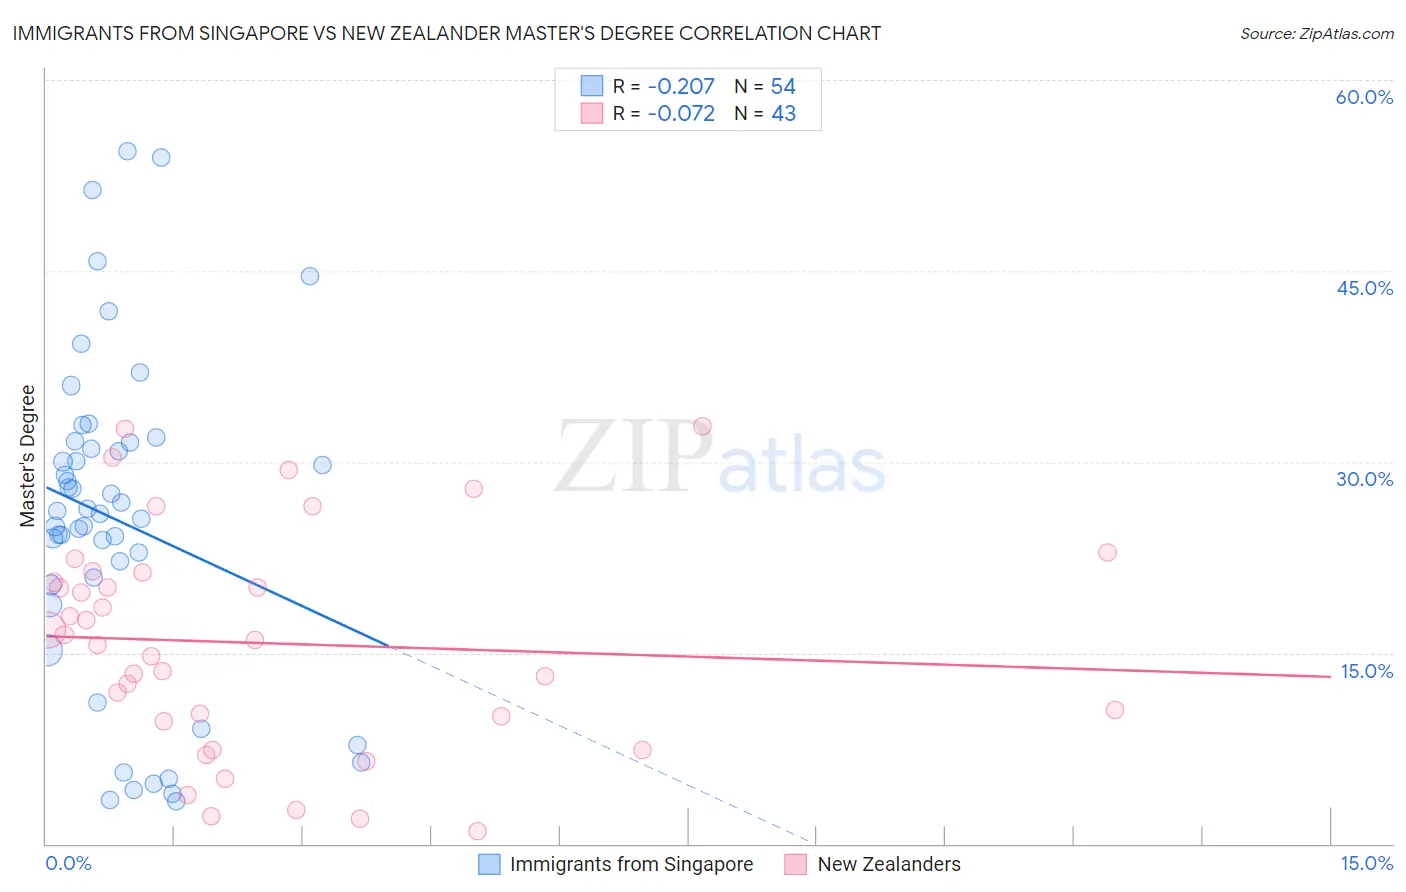
Immigrants from Singapore vs New Zealander Master's Degree Correlation Chart
The statistical analysis conducted on geographies consisting of 137,491,179 people shows a weak negative correlation between the proportion of Immigrants from Singapore and percentage of population with at least master's degree education in the United States with a correlation coefficient (R) of -0.207 and weighted average of 23.4%. Similarly, the statistical analysis conducted on geographies consisting of 106,899,684 people shows a slight negative correlation between the proportion of New Zealanders and percentage of population with at least master's degree education in the United States with a correlation coefficient (R) of -0.072 and weighted average of 18.3%, a difference of 28.2%.
Master's Degree Correlation Summary
| Measurement | Immigrants from Singapore | New Zealander |
| Minimum | 3.3% | 1.0% |
| Maximum | 54.4% | 32.8% |
| Range | 51.1% | 31.8% |
| Mean | 25.3% | 15.8% |
| Median | 26.0% | 16.0% |
| Interquartile 25% (IQ1) | 20.4% | 9.6% |
| Interquartile 75% (IQ3) | 31.5% | 21.3% |
| Interquartile Range (IQR) | 11.2% | 11.7% |
| Standard Deviation (Sample) | 12.8% | 8.6% |
| Standard Deviation (Population) | 12.7% | 8.5% |
Similar Demographics by Master's Degree
Demographics Similar to Immigrants from Singapore by Master's Degree
In terms of master's degree, the demographic groups most similar to Immigrants from Singapore are Filipino (23.4%, a difference of 0.050%), Immigrants from Israel (22.6%, a difference of 3.4%), Okinawan (22.6%, a difference of 3.4%), Immigrants from Taiwan (22.5%, a difference of 4.3%), and Immigrants from India (22.3%, a difference of 5.0%).
| Demographics | Rating | Rank | Master's Degree |
| Immigrants | Singapore | 100.0 /100 | #1 | Exceptional 23.4% |
| Filipinos | 100.0 /100 | #2 | Exceptional 23.4% |
| Immigrants | Israel | 100.0 /100 | #3 | Exceptional 22.6% |
| Okinawans | 100.0 /100 | #4 | Exceptional 22.6% |
| Immigrants | Taiwan | 100.0 /100 | #5 | Exceptional 22.5% |
| Immigrants | India | 100.0 /100 | #6 | Exceptional 22.3% |
| Iranians | 100.0 /100 | #7 | Exceptional 22.3% |
| Cypriots | 100.0 /100 | #8 | Exceptional 21.8% |
| Thais | 100.0 /100 | #9 | Exceptional 21.7% |
| Immigrants | Iran | 100.0 /100 | #10 | Exceptional 21.6% |
| Immigrants | China | 100.0 /100 | #11 | Exceptional 21.2% |
| Eastern Europeans | 100.0 /100 | #12 | Exceptional 21.1% |
| Immigrants | Australia | 100.0 /100 | #13 | Exceptional 20.9% |
| Immigrants | Switzerland | 100.0 /100 | #14 | Exceptional 20.9% |
| Immigrants | Eastern Asia | 100.0 /100 | #15 | Exceptional 20.8% |
Demographics Similar to New Zealanders by Master's Degree
In terms of master's degree, the demographic groups most similar to New Zealanders are Immigrants from Europe (18.2%, a difference of 0.15%), Immigrants from Bulgaria (18.3%, a difference of 0.23%), Argentinean (18.2%, a difference of 0.51%), Australian (18.4%, a difference of 0.66%), and Immigrants from Asia (18.4%, a difference of 0.80%).
| Demographics | Rating | Rank | Master's Degree |
| Immigrants | Czechoslovakia | 99.9 /100 | #53 | Exceptional 18.5% |
| Immigrants | Lithuania | 99.9 /100 | #54 | Exceptional 18.5% |
| Immigrants | Serbia | 99.9 /100 | #55 | Exceptional 18.5% |
| Asians | 99.9 /100 | #56 | Exceptional 18.4% |
| Immigrants | Asia | 99.9 /100 | #57 | Exceptional 18.4% |
| Australians | 99.9 /100 | #58 | Exceptional 18.4% |
| Immigrants | Bulgaria | 99.9 /100 | #59 | Exceptional 18.3% |
| New Zealanders | 99.9 /100 | #60 | Exceptional 18.3% |
| Immigrants | Europe | 99.9 /100 | #61 | Exceptional 18.2% |
| Argentineans | 99.9 /100 | #62 | Exceptional 18.2% |
| Immigrants | Netherlands | 99.9 /100 | #63 | Exceptional 18.1% |
| South Africans | 99.9 /100 | #64 | Exceptional 18.1% |
| Immigrants | Kazakhstan | 99.8 /100 | #65 | Exceptional 18.0% |
| Ethiopians | 99.8 /100 | #66 | Exceptional 18.0% |
| Immigrants | Argentina | 99.8 /100 | #67 | Exceptional 18.0% |