Mexican American Indian vs Vietnamese Master's Degree
COMPARE
Mexican American Indian
Vietnamese
Master's Degree
Master's Degree Comparison
Mexican American Indians
Vietnamese
11.2%
MASTER'S DEGREE
0.0/ 100
METRIC RATING
306th/ 347
METRIC RANK
15.8%
MASTER'S DEGREE
85.5/ 100
METRIC RATING
140th/ 347
METRIC RANK
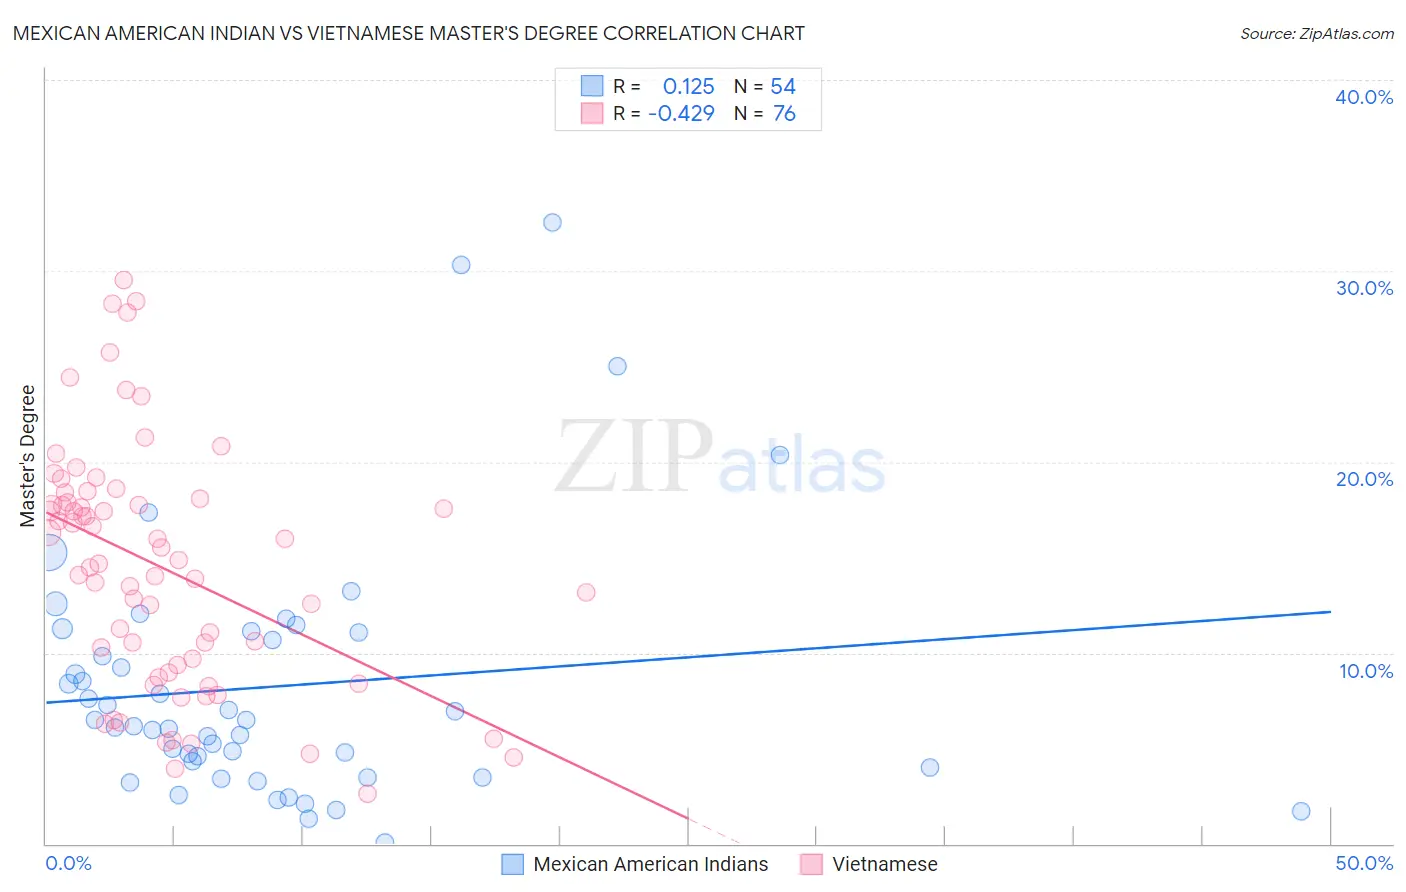
Mexican American Indian vs Vietnamese Master's Degree Correlation Chart
The statistical analysis conducted on geographies consisting of 317,480,404 people shows a poor positive correlation between the proportion of Mexican American Indians and percentage of population with at least master's degree education in the United States with a correlation coefficient (R) of 0.125 and weighted average of 11.2%. Similarly, the statistical analysis conducted on geographies consisting of 170,730,532 people shows a moderate negative correlation between the proportion of Vietnamese and percentage of population with at least master's degree education in the United States with a correlation coefficient (R) of -0.429 and weighted average of 15.8%, a difference of 40.2%.
Master's Degree Correlation Summary
| Measurement | Mexican American Indian | Vietnamese |
| Minimum | 0.093% | 2.6% |
| Maximum | 32.5% | 29.5% |
| Range | 32.4% | 26.9% |
| Mean | 8.2% | 14.5% |
| Median | 6.3% | 14.8% |
| Interquartile 25% (IQ1) | 4.0% | 9.2% |
| Interquartile 75% (IQ3) | 11.1% | 18.0% |
| Interquartile Range (IQR) | 7.1% | 8.8% |
| Standard Deviation (Sample) | 6.7% | 6.4% |
| Standard Deviation (Population) | 6.6% | 6.3% |
Similar Demographics by Master's Degree
Demographics Similar to Mexican American Indians by Master's Degree
In terms of master's degree, the demographic groups most similar to Mexican American Indians are Cheyenne (11.2%, a difference of 0.15%), Immigrants from Latin America (11.3%, a difference of 0.19%), Puerto Rican (11.2%, a difference of 0.70%), Immigrants from Cabo Verde (11.3%, a difference of 0.84%), and Puget Sound Salish (11.1%, a difference of 0.99%).
| Demographics | Rating | Rank | Master's Degree |
| Chickasaw | 0.1 /100 | #299 | Tragic 11.4% |
| Chippewa | 0.1 /100 | #300 | Tragic 11.4% |
| Tsimshian | 0.1 /100 | #301 | Tragic 11.4% |
| Cherokee | 0.1 /100 | #302 | Tragic 11.4% |
| Immigrants | Laos | 0.1 /100 | #303 | Tragic 11.4% |
| Immigrants | Cabo Verde | 0.1 /100 | #304 | Tragic 11.3% |
| Immigrants | Latin America | 0.0 /100 | #305 | Tragic 11.3% |
| Mexican American Indians | 0.0 /100 | #306 | Tragic 11.2% |
| Cheyenne | 0.0 /100 | #307 | Tragic 11.2% |
| Puerto Ricans | 0.0 /100 | #308 | Tragic 11.2% |
| Puget Sound Salish | 0.0 /100 | #309 | Tragic 11.1% |
| Shoshone | 0.0 /100 | #310 | Tragic 11.1% |
| Seminole | 0.0 /100 | #311 | Tragic 11.0% |
| Choctaw | 0.0 /100 | #312 | Tragic 11.0% |
| Yaqui | 0.0 /100 | #313 | Tragic 11.0% |
Demographics Similar to Vietnamese by Master's Degree
In terms of master's degree, the demographic groups most similar to Vietnamese are Immigrants from Germany (15.8%, a difference of 0.090%), Polish (15.7%, a difference of 0.12%), Pakistani (15.8%, a difference of 0.14%), European (15.8%, a difference of 0.22%), and Assyrian/Chaldean/Syriac (15.8%, a difference of 0.33%).
| Demographics | Rating | Rank | Master's Degree |
| Immigrants | Sudan | 90.2 /100 | #133 | Exceptional 16.0% |
| Venezuelans | 88.4 /100 | #134 | Excellent 15.9% |
| South American Indians | 88.4 /100 | #135 | Excellent 15.9% |
| Assyrians/Chaldeans/Syriacs | 86.8 /100 | #136 | Excellent 15.8% |
| Europeans | 86.4 /100 | #137 | Excellent 15.8% |
| Pakistanis | 86.1 /100 | #138 | Excellent 15.8% |
| Immigrants | Germany | 85.9 /100 | #139 | Excellent 15.8% |
| Vietnamese | 85.5 /100 | #140 | Excellent 15.8% |
| Poles | 85.0 /100 | #141 | Excellent 15.7% |
| Immigrants | Africa | 84.0 /100 | #142 | Excellent 15.7% |
| Immigrants | Venezuela | 83.6 /100 | #143 | Excellent 15.7% |
| Canadians | 83.3 /100 | #144 | Excellent 15.7% |
| South Americans | 81.3 /100 | #145 | Excellent 15.6% |
| Immigrants | Afghanistan | 79.4 /100 | #146 | Good 15.6% |
| Hungarians | 79.1 /100 | #147 | Good 15.6% |