Austrian vs New Zealander Master's Degree

COMPARE

Austrian
Race
Ancestry
AfghanAfricanAlaska NativeAlaskan AthabascanAlbanianAleutAlsatianAmericanApacheArabArapahoArgentineanArmenianAssyrian/Chaldean/SyriacAustralianAustrianBahamianBangladeshiBarbadianBasqueBelgianBelizeanBermudanBhutaneseBlackfeetBolivianBrazilianBritishBritish West IndianBulgarianBurmeseCajunCambodianCanadianCape VerdeanCarpatho RusynCelticCentral AmericanCentral American IndianCherokeeCheyenneChickasawChileanChineseChippewaChoctawColombianColvilleComancheCosta RicanCreeCreekCroatianCrowCubanCypriotCzechCzechoslovakianDanishDelawareDominicanDutchDutch West IndianEastern EuropeanEcuadorianEgyptianEnglishEstonianEthiopianEuropeanFijianFilipinoFinnishFrenchFrench American IndianFrench CanadianGermanGerman RussianGhanaianGreekGuamanian/ChamorroGuatemalanGuyaneseHaitianHmongHonduranHopiHoumaHungarianIcelanderIndian (Asian)IndonesianInupiatIranianIraqiIrishIroquoisIsraeliItalianJamaicanJapaneseJordanianKenyanKiowaKoreanLaotianLatvianLebaneseLiberianLithuanianLumbeeLuxembourgerMacedonianMalaysianMalteseMarshalleseMenomineeMexicanMexican American IndianMongolianMoroccanNative HawaiianNavajoNepaleseNicaraguanNigerianNorthern EuropeanNorwegianOkinawanOsageOttawaPaiutePakistaniPalestinianPanamanianParaguayanPennsylvania GermanPeruvianPimaPolishPortuguesePotawatomiPuebloPuerto RicanPuget Sound SalishRomanianRussianSalvadoranSamoanScandinavianScotch-IrishScottishSeminoleSenegaleseSerbianShoshoneSierra LeoneanSiouxSlavicSlovakSloveneSomaliSouth AfricanSouth AmericanSouth American IndianSoviet UnionSpaniardSpanishSpanish AmericanSpanish American IndianSri LankanSubsaharan AfricanSudaneseSwedishSwissSyrianTaiwaneseThaiTlingit-HaidaTohono O'OdhamTonganTrinidadian and TobagonianTsimshianTurkishU.S. Virgin IslanderUgandanUkrainianUruguayanUteVenezuelanVietnameseWelshWest IndianYakamaYaquiYugoslavianYumanYup'ikZimbabwean
Immigration
NonimmigrantsImmigrantsAfghanistanAfricaAlbaniaArgentinaArmeniaAsiaAustraliaAustriaBahamasBangladeshBarbadosBelarusBelgiumBelizeBoliviaBosnia and HerzegovinaBrazilBulgariaBurma/MyanmarCabo VerdeCambodiaCameroonCanadaCaribbeanCentral AmericaChileChinaColombiaCongoCosta RicaCroatiaCubaCzechoslovakiaDenmarkDominicaDominican RepublicEastern AfricaEastern AsiaEastern EuropeEcuadorEgyptEl SalvadorEnglandEritreaEthiopiaEuropeFijiFranceGermanyGhanaGreeceGrenadaGuatemalaGuyanaHaitiHondurasHong KongHungaryIndiaIndonesiaIranIraqIrelandIsraelItalyJamaicaJapanJordanKazakhstanKenyaKoreaKuwaitLaosLatin AmericaLatviaLebanonLiberiaLithuaniaMalaysiaMexicoMicronesiaMiddle AfricaMoldovaMoroccoNepalNetherlandsNicaraguaNigeriaNorth AmericaNorth MacedoniaNorthern AfricaNorthern EuropeNorwayOceaniaPakistanPanamaPeruPhilippinesPolandPortugalRomaniaRussiaSaudi ArabiaScotlandSenegalSerbiaSierra LeoneSingaporeSomaliaSouth AfricaSouth AmericaSouth Central AsiaSouth Eastern AsiaSouthern EuropeSpainSri LankaSt. Vincent and the GrenadinesSudanSwedenSwitzerlandSyriaTaiwanThailandTrinidad and TobagoTurkeyUgandaUkraineUruguayUzbekistanVenezuelaVietnamWest IndiesWestern AfricaWestern AsiaWestern EuropeYemenZaireZimbabweAzores
New Zealander
Race
Ancestry
AfghanAfricanAlaska NativeAlaskan AthabascanAlbanianAleutAlsatianAmericanApacheArabArapahoArgentineanArmenianAssyrian/Chaldean/SyriacAustralianBahamianBangladeshiBarbadianBasqueBelgianBelizeanBermudanBhutaneseBlackfeetBolivianBrazilianBritishBritish West IndianBulgarianBurmeseCajunCambodianCanadianCape VerdeanCarpatho RusynCelticCentral AmericanCentral American IndianCherokeeCheyenneChickasawChileanChineseChippewaChoctawColombianColvilleComancheCosta RicanCreeCreekCroatianCrowCubanCypriotCzechCzechoslovakianDanishDelawareDominicanDutchDutch West IndianEastern EuropeanEcuadorianEgyptianEnglishEstonianEthiopianEuropeanFijianFilipinoFinnishFrenchFrench American IndianFrench CanadianGermanGerman RussianGhanaianGreekGuamanian/ChamorroGuatemalanGuyaneseHaitianHmongHonduranHopiHoumaHungarianIcelanderIndian (Asian)IndonesianInupiatIranianIraqiIrishIroquoisIsraeliItalianJamaicanJapaneseJordanianKenyanKiowaKoreanLaotianLatvianLebaneseLiberianLithuanianLumbeeLuxembourgerMacedonianMalaysianMalteseMarshalleseMenomineeMexicanMexican American IndianMongolianMoroccanNative HawaiianNavajoNepaleseNew ZealanderNicaraguanNigerianNorthern EuropeanNorwegianOkinawanOsageOttawaPaiutePakistaniPalestinianPanamanianParaguayanPennsylvania GermanPeruvianPimaPolishPortuguesePotawatomiPuebloPuerto RicanPuget Sound SalishRomanianRussianSalvadoranSamoanScandinavianScotch-IrishScottishSeminoleSenegaleseSerbianShoshoneSierra LeoneanSiouxSlavicSlovakSloveneSomaliSouth AfricanSouth AmericanSouth American IndianSoviet UnionSpaniardSpanishSpanish AmericanSpanish American IndianSri LankanSubsaharan AfricanSudaneseSwedishSwissSyrianTaiwaneseThaiTlingit-HaidaTohono O'OdhamTonganTrinidadian and TobagonianTsimshianTurkishU.S. Virgin IslanderUgandanUkrainianUruguayanUteVenezuelanVietnameseWelshWest IndianYakamaYaquiYugoslavianYumanYup'ikZimbabwean
Immigration
NonimmigrantsImmigrantsAfghanistanAfricaAlbaniaArgentinaArmeniaAsiaAustraliaAustriaBahamasBangladeshBarbadosBelarusBelgiumBelizeBoliviaBosnia and HerzegovinaBrazilBulgariaBurma/MyanmarCabo VerdeCambodiaCameroonCanadaCaribbeanCentral AmericaChileChinaColombiaCongoCosta RicaCroatiaCubaCzechoslovakiaDenmarkDominicaDominican RepublicEastern AfricaEastern AsiaEastern EuropeEcuadorEgyptEl SalvadorEnglandEritreaEthiopiaEuropeFijiFranceGermanyGhanaGreeceGrenadaGuatemalaGuyanaHaitiHondurasHong KongHungaryIndiaIndonesiaIranIraqIrelandIsraelItalyJamaicaJapanJordanKazakhstanKenyaKoreaKuwaitLaosLatin AmericaLatviaLebanonLiberiaLithuaniaMalaysiaMexicoMicronesiaMiddle AfricaMoldovaMoroccoNepalNetherlandsNicaraguaNigeriaNorth AmericaNorth MacedoniaNorthern AfricaNorthern EuropeNorwayOceaniaPakistanPanamaPeruPhilippinesPolandPortugalRomaniaRussiaSaudi ArabiaScotlandSenegalSerbiaSierra LeoneSingaporeSomaliaSouth AfricaSouth AmericaSouth Central AsiaSouth Eastern AsiaSouthern EuropeSpainSri LankaSt. Vincent and the GrenadinesSudanSwedenSwitzerlandSyriaTaiwanThailandTrinidad and TobagoTurkeyUgandaUkraineUruguayUzbekistanVenezuelaVietnamWest IndiesWestern AfricaWestern AsiaWestern EuropeYemenZaireZimbabweAzores
Master's Degree
Income
Poverty
Unemployment
Labor Participation
Family Structure
Vehicle Availability
Education Level
Disability

Master's Degree Comparison

Austrians

New Zealanders

Exceptional
Exceptional
16.7%
MASTER'S DEGREE
97.8/ 100
METRIC RATING
111th/ 347
METRIC RANK
18.3%
MASTER'S DEGREE
99.9/ 100
METRIC RATING
60th/ 347
METRIC RANK

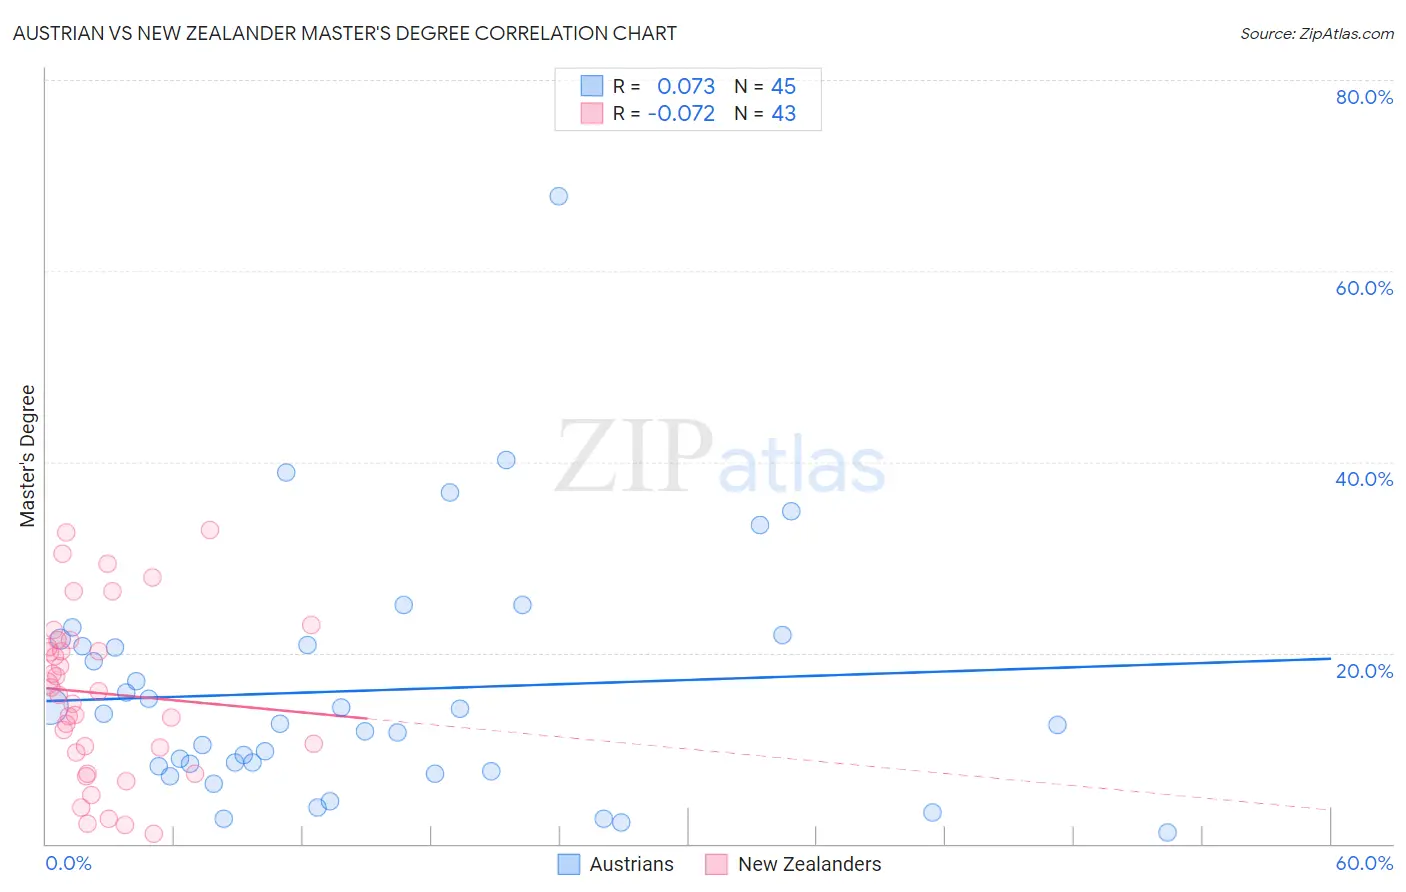
Austrian vs New Zealander Master's Degree Correlation Chart

The statistical analysis conducted on geographies consisting of 451,930,170 people shows a slight positive correlation between the proportion of Austrians and percentage of population with at least master's degree education in the United States with a correlation coefficient (R) of 0.073 and weighted average of 16.7%. Similarly, the statistical analysis conducted on geographies consisting of 106,899,684 people shows a slight negative correlation between the proportion of New Zealanders and percentage of population with at least master's degree education in the United States with a correlation coefficient (R) of -0.072 and weighted average of 18.3%, a difference of 9.2%.
Austrian vs New Zealander Master's Degree

Master's Degree Correlation Summary

MeasurementAustrianNew Zealander
Minimum1.2%1.0%
Maximum67.9%32.8%
Range66.7%31.8%
Mean16.1%15.8%
Median12.6%16.0%
Interquartile 25% (IQ1)7.9%9.6%
Interquartile 75% (IQ3)21.1%21.3%
Interquartile Range (IQR)13.2%11.7%
Standard Deviation (Sample)12.8%8.6%
Standard Deviation (Population)12.7%8.5%

Similar Demographics by Master's Degree

Demographics Similar to Austrians by Master's Degree

In terms of master's degree, the demographic groups most similar to Austrians are Macedonian (16.7%, a difference of 0.14%), Arab (16.7%, a difference of 0.15%), Northern European (16.7%, a difference of 0.22%), Immigrants from Chile (16.8%, a difference of 0.27%), and Moroccan (16.8%, a difference of 0.30%).
DemographicsRating | RankMaster's Degree
Ukrainians
98.3
/100
|
#104
Exceptional
16.9%
Syrians
98.3
/100
|
#105
Exceptional
16.8%
Immigrants | Albania
98.1
/100
|
#106
Exceptional
16.8%
Armenians
98.0
/100
|
#107
Exceptional
16.8%
Sierra Leoneans
98.0
/100
|
#108
Exceptional
16.8%
Moroccans
98.0
/100
|
#109
Exceptional
16.8%
Immigrants | Chile
98.0
/100
|
#110
Exceptional
16.8%
Austrians
97.8
/100
|
#111
Exceptional
16.7%
Macedonians
97.7
/100
|
#112
Exceptional
16.7%
Arabs
97.7
/100
|
#113
Exceptional
16.7%
Northern Europeans
97.6
/100
|
#114
Exceptional
16.7%
Immigrants | Uganda
97.3
/100
|
#115
Exceptional
16.6%
Immigrants | Southern Europe
97.2
/100
|
#116
Exceptional
16.6%
Immigrants | Moldova
97.2
/100
|
#117
Exceptional
16.6%
Brazilians
96.8
/100
|
#118
Exceptional
16.5%

Demographics Similar to New Zealanders by Master's Degree

In terms of master's degree, the demographic groups most similar to New Zealanders are Immigrants from Europe (18.2%, a difference of 0.15%), Immigrants from Bulgaria (18.3%, a difference of 0.23%), Argentinean (18.2%, a difference of 0.51%), Australian (18.4%, a difference of 0.66%), and Immigrants from Asia (18.4%, a difference of 0.80%).
DemographicsRating | RankMaster's Degree
Immigrants | Czechoslovakia
99.9
/100
|
#53
Exceptional
18.5%
Immigrants | Lithuania
99.9
/100
|
#54
Exceptional
18.5%
Immigrants | Serbia
99.9
/100
|
#55
Exceptional
18.5%
Asians
99.9
/100
|
#56
Exceptional
18.4%
Immigrants | Asia
99.9
/100
|
#57
Exceptional
18.4%
Australians
99.9
/100
|
#58
Exceptional
18.4%
Immigrants | Bulgaria
99.9
/100
|
#59
Exceptional
18.3%
New Zealanders
99.9
/100
|
#60
Exceptional
18.3%
Immigrants | Europe
99.9
/100
|
#61
Exceptional
18.2%
Argentineans
99.9
/100
|
#62
Exceptional
18.2%
Immigrants | Netherlands
99.9
/100
|
#63
Exceptional
18.1%
South Africans
99.9
/100
|
#64
Exceptional
18.1%
Immigrants | Kazakhstan
99.8
/100
|
#65
Exceptional
18.0%
Ethiopians
99.8
/100
|
#66
Exceptional
18.0%
Immigrants | Argentina
99.8
/100
|
#67
Exceptional
18.0%