Immigrants from Ghana vs German Russian Bachelor's Degree
COMPARE
Immigrants from Ghana
German Russian
Bachelor's Degree
Bachelor's Degree Comparison
Immigrants from Ghana
German Russians
36.9%
BACHELOR'S DEGREE
27.4/ 100
METRIC RATING
200th/ 347
METRIC RANK
35.8%
BACHELOR'S DEGREE
10.2/ 100
METRIC RATING
217th/ 347
METRIC RANK
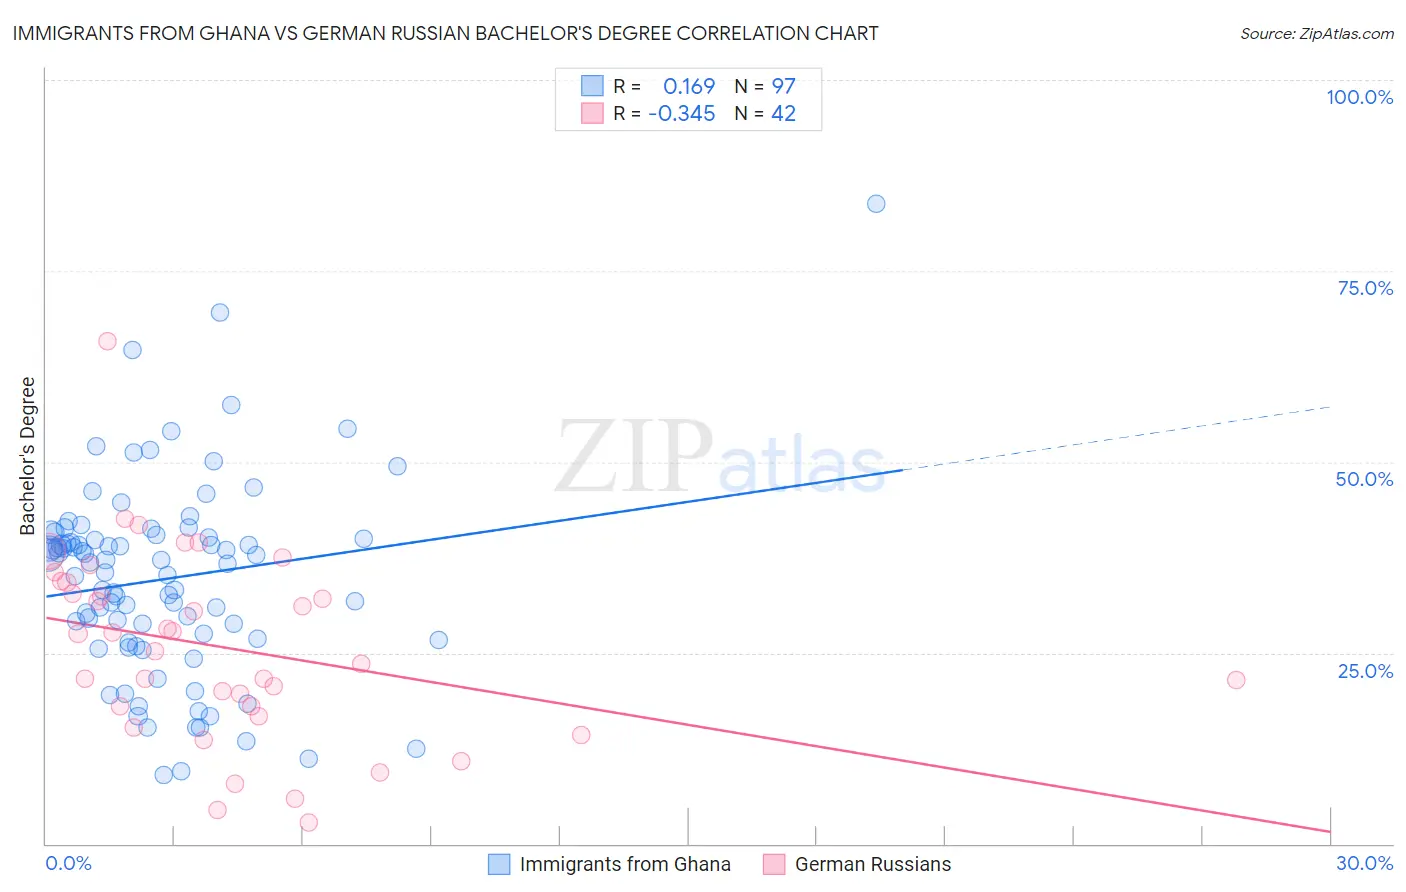
Immigrants from Ghana vs German Russian Bachelor's Degree Correlation Chart
The statistical analysis conducted on geographies consisting of 199,935,745 people shows a poor positive correlation between the proportion of Immigrants from Ghana and percentage of population with at least bachelor's degree education in the United States with a correlation coefficient (R) of 0.169 and weighted average of 36.9%. Similarly, the statistical analysis conducted on geographies consisting of 96,460,010 people shows a mild negative correlation between the proportion of German Russians and percentage of population with at least bachelor's degree education in the United States with a correlation coefficient (R) of -0.345 and weighted average of 35.8%, a difference of 3.1%.
Bachelor's Degree Correlation Summary
| Measurement | Immigrants from Ghana | German Russian |
| Minimum | 9.1% | 2.8% |
| Maximum | 83.8% | 65.8% |
| Range | 74.7% | 63.0% |
| Mean | 34.7% | 25.7% |
| Median | 36.8% | 26.4% |
| Interquartile 25% (IQ1) | 26.7% | 18.0% |
| Interquartile 75% (IQ3) | 40.3% | 34.3% |
| Interquartile Range (IQR) | 13.5% | 16.3% |
| Standard Deviation (Sample) | 12.8% | 12.5% |
| Standard Deviation (Population) | 12.7% | 12.3% |
Demographics Similar to Immigrants from Ghana and German Russians by Bachelor's Degree
In terms of bachelor's degree, the demographic groups most similar to Immigrants from Ghana are Immigrants from Costa Rica (36.9%, a difference of 0.0%), Welsh (37.0%, a difference of 0.21%), Immigrants from South Eastern Asia (36.8%, a difference of 0.26%), Immigrants from Zaire (36.8%, a difference of 0.27%), and Immigrants from Nigeria (36.7%, a difference of 0.57%). Similarly, the demographic groups most similar to German Russians are Subsaharan African (35.8%, a difference of 0.10%), Barbadian (36.1%, a difference of 0.81%), Immigrants from Western Africa (36.1%, a difference of 0.87%), German (36.1%, a difference of 0.91%), and Immigrants from Panama (36.2%, a difference of 0.97%).
| Demographics | Rating | Rank | Bachelor's Degree |
| Welsh | 29.1 /100 | #198 | Fair 37.0% |
| Immigrants | Costa Rica | 27.4 /100 | #199 | Fair 36.9% |
| Immigrants | Ghana | 27.4 /100 | #200 | Fair 36.9% |
| Immigrants | South Eastern Asia | 25.4 /100 | #201 | Fair 36.8% |
| Immigrants | Zaire | 25.3 /100 | #202 | Fair 36.8% |
| Immigrants | Nigeria | 23.1 /100 | #203 | Fair 36.7% |
| Immigrants | Immigrants | 22.8 /100 | #204 | Fair 36.7% |
| Finns | 22.2 /100 | #205 | Fair 36.7% |
| Spaniards | 21.2 /100 | #206 | Fair 36.6% |
| Immigrants | Middle Africa | 20.6 /100 | #207 | Fair 36.6% |
| Immigrants | Thailand | 19.4 /100 | #208 | Poor 36.5% |
| Panamanians | 18.8 /100 | #209 | Poor 36.5% |
| French | 18.6 /100 | #210 | Poor 36.5% |
| Scotch-Irish | 18.3 /100 | #211 | Poor 36.4% |
| Immigrants | Philippines | 17.8 /100 | #212 | Poor 36.4% |
| Immigrants | Panama | 14.2 /100 | #213 | Poor 36.2% |
| Germans | 13.9 /100 | #214 | Poor 36.1% |
| Immigrants | Western Africa | 13.8 /100 | #215 | Poor 36.1% |
| Barbadians | 13.5 /100 | #216 | Poor 36.1% |
| German Russians | 10.2 /100 | #217 | Poor 35.8% |
| Sub-Saharan Africans | 9.8 /100 | #218 | Tragic 35.8% |