Mexican American Indian vs Bahamian Bachelor's Degree
COMPARE
Mexican American Indian
Bahamian
Bachelor's Degree
Bachelor's Degree Comparison
Mexican American Indians
Bahamians
30.2%
BACHELOR'S DEGREE
0.0/ 100
METRIC RATING
302nd/ 347
METRIC RANK
32.5%
BACHELOR'S DEGREE
0.3/ 100
METRIC RATING
265th/ 347
METRIC RANK
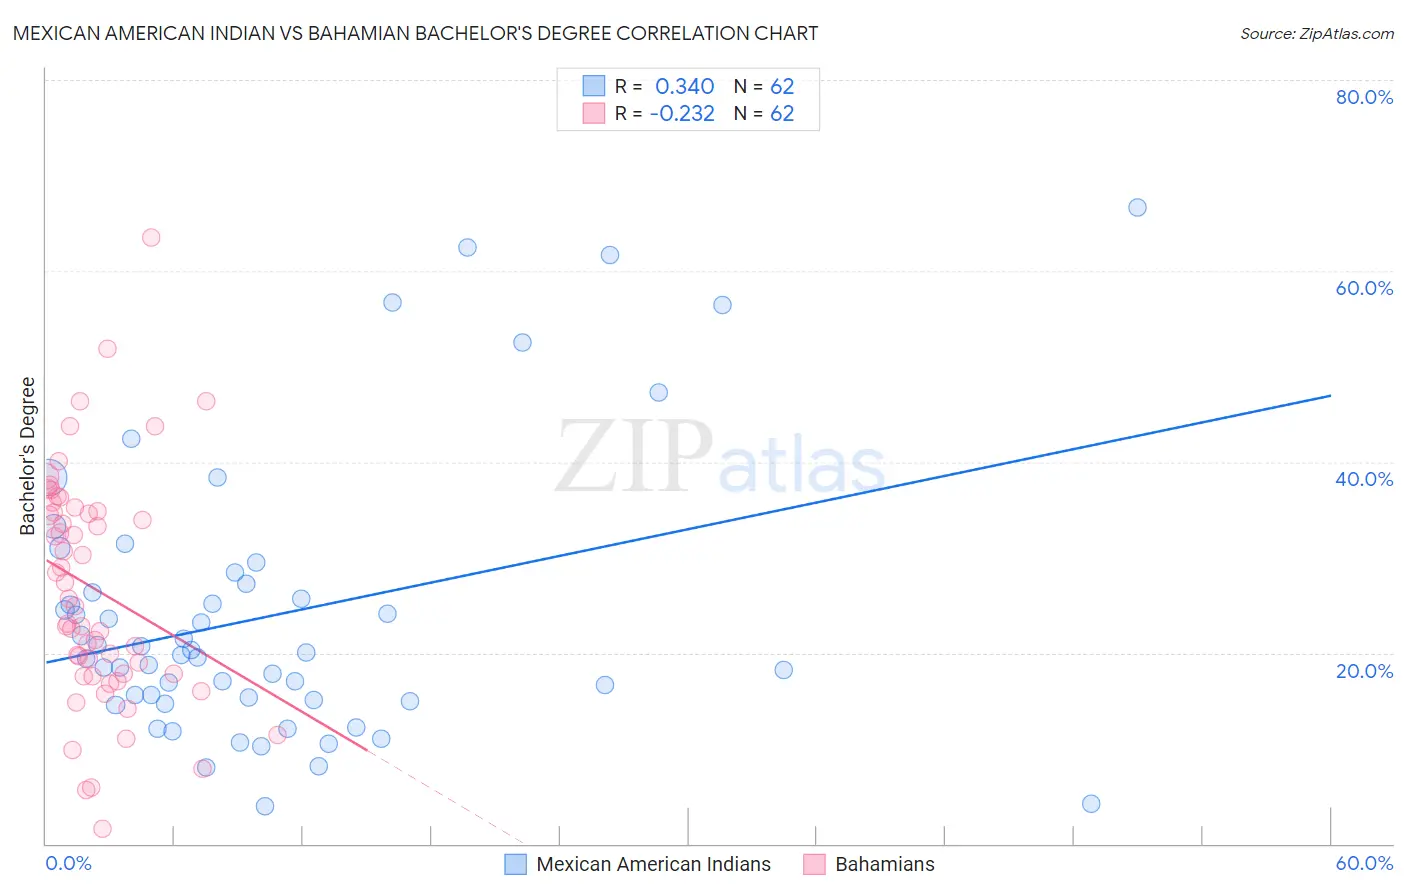
Mexican American Indian vs Bahamian Bachelor's Degree Correlation Chart
The statistical analysis conducted on geographies consisting of 317,609,381 people shows a mild positive correlation between the proportion of Mexican American Indians and percentage of population with at least bachelor's degree education in the United States with a correlation coefficient (R) of 0.340 and weighted average of 30.2%. Similarly, the statistical analysis conducted on geographies consisting of 112,698,493 people shows a weak negative correlation between the proportion of Bahamians and percentage of population with at least bachelor's degree education in the United States with a correlation coefficient (R) of -0.232 and weighted average of 32.5%, a difference of 7.6%.
Bachelor's Degree Correlation Summary
| Measurement | Mexican American Indian | Bahamian |
| Minimum | 3.9% | 1.5% |
| Maximum | 66.7% | 63.5% |
| Range | 62.8% | 61.9% |
| Mean | 24.0% | 26.7% |
| Median | 19.9% | 25.3% |
| Interquartile 25% (IQ1) | 15.0% | 17.8% |
| Interquartile 75% (IQ3) | 27.2% | 34.8% |
| Interquartile Range (IQR) | 12.2% | 17.0% |
| Standard Deviation (Sample) | 14.5% | 12.1% |
| Standard Deviation (Population) | 14.4% | 12.0% |
Similar Demographics by Bachelor's Degree
Demographics Similar to Mexican American Indians by Bachelor's Degree
In terms of bachelor's degree, the demographic groups most similar to Mexican American Indians are Bangladeshi (30.2%, a difference of 0.17%), Cherokee (30.2%, a difference of 0.17%), Immigrants from Cuba (30.3%, a difference of 0.28%), Immigrants from Micronesia (30.4%, a difference of 0.49%), and Chickasaw (30.4%, a difference of 0.51%).
| Demographics | Rating | Rank | Bachelor's Degree |
| Immigrants | Dominican Republic | 0.0 /100 | #295 | Tragic 30.7% |
| Puget Sound Salish | 0.0 /100 | #296 | Tragic 30.7% |
| Immigrants | Haiti | 0.0 /100 | #297 | Tragic 30.6% |
| Chippewa | 0.0 /100 | #298 | Tragic 30.6% |
| Chickasaw | 0.0 /100 | #299 | Tragic 30.4% |
| Immigrants | Micronesia | 0.0 /100 | #300 | Tragic 30.4% |
| Immigrants | Cuba | 0.0 /100 | #301 | Tragic 30.3% |
| Mexican American Indians | 0.0 /100 | #302 | Tragic 30.2% |
| Bangladeshis | 0.0 /100 | #303 | Tragic 30.2% |
| Cherokee | 0.0 /100 | #304 | Tragic 30.2% |
| Immigrants | Latin America | 0.0 /100 | #305 | Tragic 30.1% |
| Immigrants | Yemen | 0.0 /100 | #306 | Tragic 29.9% |
| Nepalese | 0.0 /100 | #307 | Tragic 29.9% |
| Cajuns | 0.0 /100 | #308 | Tragic 29.6% |
| Hispanics or Latinos | 0.0 /100 | #309 | Tragic 29.6% |
Demographics Similar to Bahamians by Bachelor's Degree
In terms of bachelor's degree, the demographic groups most similar to Bahamians are Central American Indian (32.5%, a difference of 0.030%), Immigrants from Dominica (32.5%, a difference of 0.030%), Cuban (32.5%, a difference of 0.15%), Belizean (32.8%, a difference of 0.81%), and Immigrants from Portugal (32.2%, a difference of 0.91%).
| Demographics | Rating | Rank | Bachelor's Degree |
| French American Indians | 0.6 /100 | #258 | Tragic 33.1% |
| Osage | 0.5 /100 | #259 | Tragic 33.0% |
| Malaysians | 0.5 /100 | #260 | Tragic 32.9% |
| Africans | 0.5 /100 | #261 | Tragic 32.9% |
| Immigrants | Jamaica | 0.5 /100 | #262 | Tragic 32.9% |
| Belizeans | 0.4 /100 | #263 | Tragic 32.8% |
| Central American Indians | 0.3 /100 | #264 | Tragic 32.5% |
| Bahamians | 0.3 /100 | #265 | Tragic 32.5% |
| Immigrants | Dominica | 0.3 /100 | #266 | Tragic 32.5% |
| Cubans | 0.3 /100 | #267 | Tragic 32.5% |
| Immigrants | Portugal | 0.2 /100 | #268 | Tragic 32.2% |
| Immigrants | Belize | 0.2 /100 | #269 | Tragic 32.1% |
| Immigrants | Nicaragua | 0.2 /100 | #270 | Tragic 31.9% |
| Central Americans | 0.2 /100 | #271 | Tragic 31.9% |
| Comanche | 0.2 /100 | #272 | Tragic 31.9% |