Menominee vs Immigrants from Netherlands 3rd Grade
COMPARE
Menominee
Immigrants from Netherlands
3rd Grade
3rd Grade Comparison
Menominee
Immigrants from Netherlands
98.0%
3RD GRADE
95.4/ 100
METRIC RATING
114th/ 347
METRIC RANK
98.2%
3RD GRADE
99.3/ 100
METRIC RATING
74th/ 347
METRIC RANK
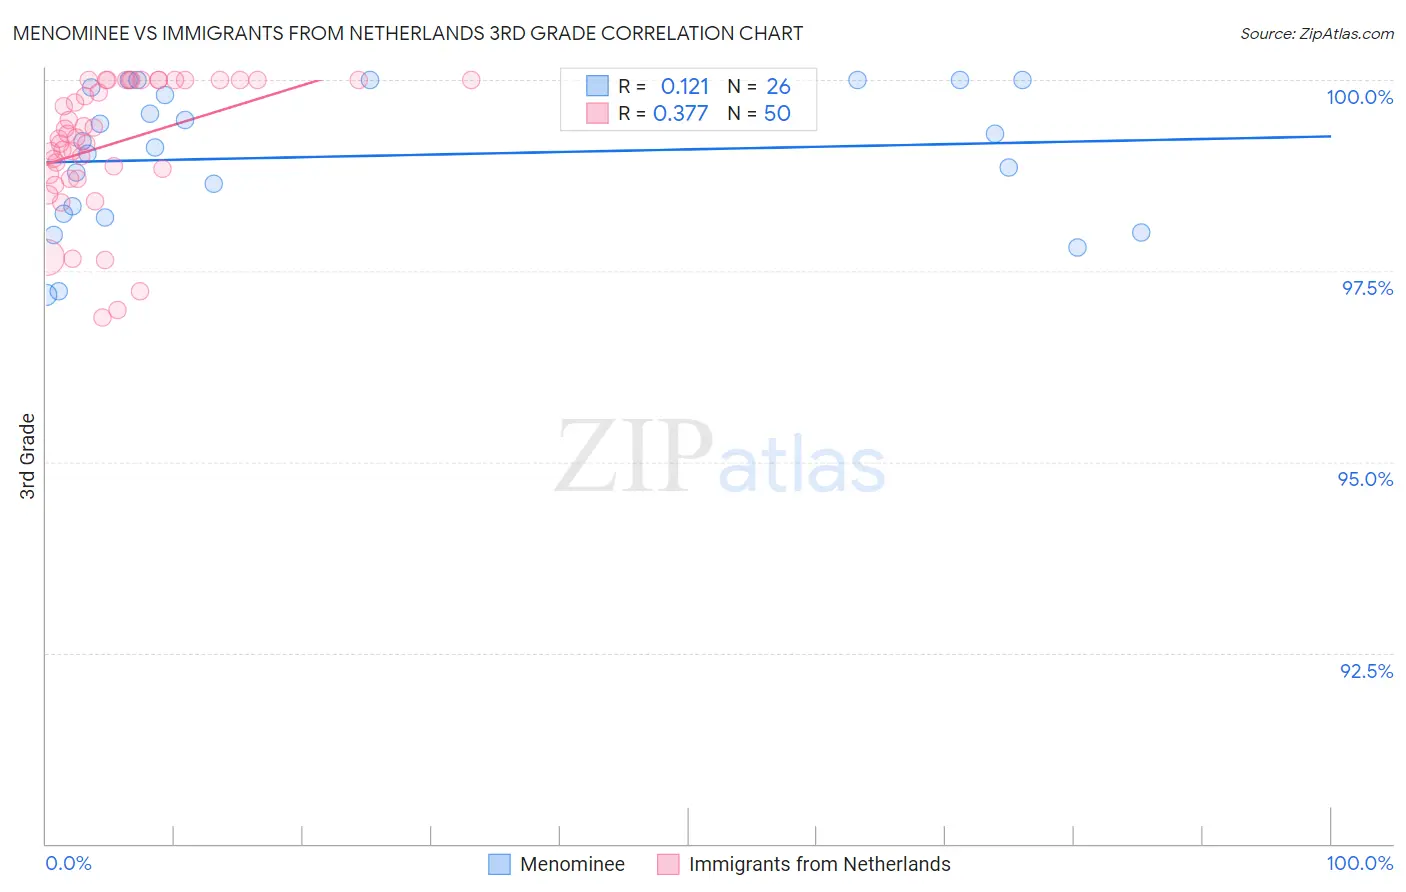
Menominee vs Immigrants from Netherlands 3rd Grade Correlation Chart
The statistical analysis conducted on geographies consisting of 45,778,979 people shows a poor positive correlation between the proportion of Menominee and percentage of population with at least 3rd grade education in the United States with a correlation coefficient (R) of 0.121 and weighted average of 98.0%. Similarly, the statistical analysis conducted on geographies consisting of 237,869,934 people shows a mild positive correlation between the proportion of Immigrants from Netherlands and percentage of population with at least 3rd grade education in the United States with a correlation coefficient (R) of 0.377 and weighted average of 98.2%, a difference of 0.16%.
3rd Grade Correlation Summary
| Measurement | Menominee | Immigrants from Netherlands |
| Minimum | 97.2% | 96.9% |
| Maximum | 100.0% | 100.0% |
| Range | 2.8% | 3.1% |
| Mean | 99.0% | 99.2% |
| Median | 99.2% | 99.3% |
| Interquartile 25% (IQ1) | 98.3% | 98.8% |
| Interquartile 75% (IQ3) | 99.9% | 100.0% |
| Interquartile Range (IQR) | 1.6% | 1.2% |
| Standard Deviation (Sample) | 0.89% | 0.86% |
| Standard Deviation (Population) | 0.88% | 0.85% |
Similar Demographics by 3rd Grade
Demographics Similar to Menominee by 3rd Grade
In terms of 3rd grade, the demographic groups most similar to Menominee are Thai (98.0%, a difference of 0.0%), Okinawan (98.0%, a difference of 0.0%), Immigrants from Norway (98.0%, a difference of 0.0%), Immigrants from Latvia (98.0%, a difference of 0.010%), and Immigrants from France (98.0%, a difference of 0.010%).
| Demographics | Rating | Rank | 3rd Grade |
| Immigrants | Czechoslovakia | 97.0 /100 | #107 | Exceptional 98.0% |
| Immigrants | Singapore | 96.7 /100 | #108 | Exceptional 98.0% |
| Pima | 96.7 /100 | #109 | Exceptional 98.0% |
| Immigrants | Switzerland | 96.6 /100 | #110 | Exceptional 98.0% |
| Basques | 96.5 /100 | #111 | Exceptional 98.0% |
| Immigrants | Latvia | 96.0 /100 | #112 | Exceptional 98.0% |
| Thais | 95.5 /100 | #113 | Exceptional 98.0% |
| Menominee | 95.4 /100 | #114 | Exceptional 98.0% |
| Okinawans | 95.2 /100 | #115 | Exceptional 98.0% |
| Immigrants | Norway | 95.2 /100 | #116 | Exceptional 98.0% |
| Immigrants | France | 95.1 /100 | #117 | Exceptional 98.0% |
| Iranians | 94.9 /100 | #118 | Exceptional 98.0% |
| Spanish | 94.8 /100 | #119 | Exceptional 98.0% |
| Immigrants | Croatia | 94.4 /100 | #120 | Exceptional 98.0% |
| Iroquois | 94.1 /100 | #121 | Exceptional 98.0% |
Demographics Similar to Immigrants from Netherlands by 3rd Grade
In terms of 3rd grade, the demographic groups most similar to Immigrants from Netherlands are Cherokee (98.2%, a difference of 0.0%), Immigrants from England (98.2%, a difference of 0.0%), Cheyenne (98.2%, a difference of 0.010%), Immigrants from Lithuania (98.2%, a difference of 0.010%), and Osage (98.2%, a difference of 0.010%).
| Demographics | Rating | Rank | 3rd Grade |
| Russians | 99.6 /100 | #67 | Exceptional 98.2% |
| Immigrants | Northern Europe | 99.6 /100 | #68 | Exceptional 98.2% |
| Canadians | 99.6 /100 | #69 | Exceptional 98.2% |
| Cajuns | 99.6 /100 | #70 | Exceptional 98.2% |
| Immigrants | Austria | 99.6 /100 | #71 | Exceptional 98.2% |
| Chickasaw | 99.5 /100 | #72 | Exceptional 98.2% |
| Cheyenne | 99.3 /100 | #73 | Exceptional 98.2% |
| Immigrants | Netherlands | 99.3 /100 | #74 | Exceptional 98.2% |
| Cherokee | 99.3 /100 | #75 | Exceptional 98.2% |
| Immigrants | England | 99.2 /100 | #76 | Exceptional 98.2% |
| Immigrants | Lithuania | 99.2 /100 | #77 | Exceptional 98.2% |
| Osage | 99.2 /100 | #78 | Exceptional 98.2% |
| Immigrants | Belgium | 99.1 /100 | #79 | Exceptional 98.1% |
| Macedonians | 99.1 /100 | #80 | Exceptional 98.1% |
| Icelanders | 99.1 /100 | #81 | Exceptional 98.1% |