Menominee vs Immigrants from Korea 2nd Grade
COMPARE
Menominee
Immigrants from Korea
2nd Grade
2nd Grade Comparison
Menominee
Immigrants from Korea
98.1%
2ND GRADE
94.1/ 100
METRIC RATING
124th/ 347
METRIC RANK
97.9%
2ND GRADE
52.7/ 100
METRIC RATING
172nd/ 347
METRIC RANK
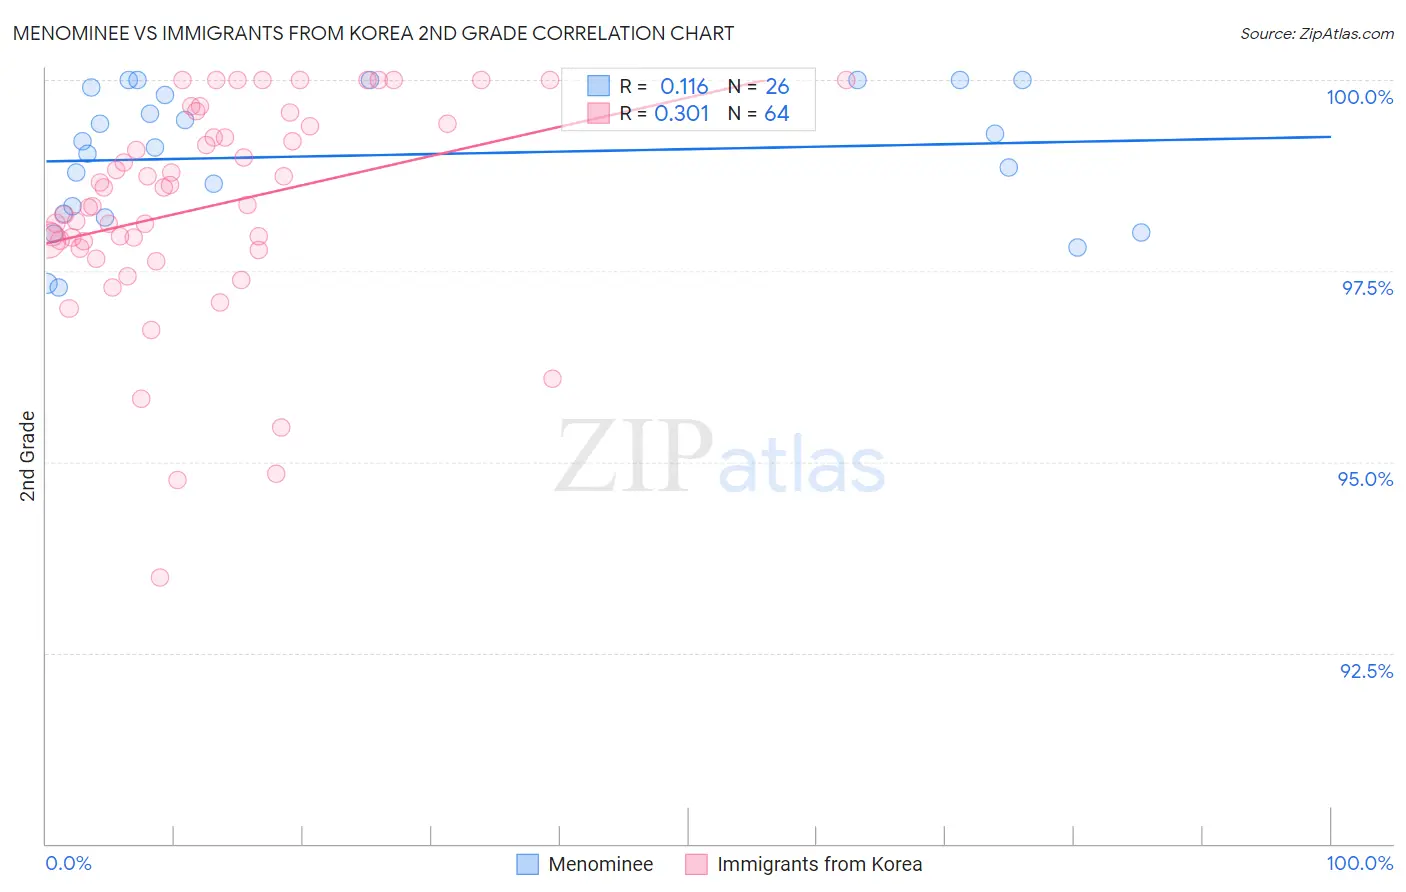
Menominee vs Immigrants from Korea 2nd Grade Correlation Chart
The statistical analysis conducted on geographies consisting of 45,778,979 people shows a poor positive correlation between the proportion of Menominee and percentage of population with at least 2nd grade education in the United States with a correlation coefficient (R) of 0.116 and weighted average of 98.1%. Similarly, the statistical analysis conducted on geographies consisting of 416,280,076 people shows a mild positive correlation between the proportion of Immigrants from Korea and percentage of population with at least 2nd grade education in the United States with a correlation coefficient (R) of 0.301 and weighted average of 97.9%, a difference of 0.21%.
2nd Grade Correlation Summary
| Measurement | Menominee | Immigrants from Korea |
| Minimum | 97.3% | 93.5% |
| Maximum | 100.0% | 100.0% |
| Range | 2.7% | 6.5% |
| Mean | 99.0% | 98.3% |
| Median | 99.2% | 98.5% |
| Interquartile 25% (IQ1) | 98.3% | 97.8% |
| Interquartile 75% (IQ3) | 99.9% | 99.4% |
| Interquartile Range (IQR) | 1.6% | 1.6% |
| Standard Deviation (Sample) | 0.88% | 1.4% |
| Standard Deviation (Population) | 0.86% | 1.4% |
Similar Demographics by 2nd Grade
Demographics Similar to Menominee by 2nd Grade
In terms of 2nd grade, the demographic groups most similar to Menominee are Immigrants from Zimbabwe (98.1%, a difference of 0.0%), Lebanese (98.1%, a difference of 0.0%), Immigrants from Japan (98.1%, a difference of 0.0%), Iroquois (98.1%, a difference of 0.0%), and Syrian (98.1%, a difference of 0.0%).
| Demographics | Rating | Rank | 2nd Grade |
| Ute | 95.7 /100 | #117 | Exceptional 98.1% |
| Immigrants | France | 95.6 /100 | #118 | Exceptional 98.1% |
| Thais | 95.3 /100 | #119 | Exceptional 98.1% |
| Okinawans | 94.9 /100 | #120 | Exceptional 98.1% |
| Immigrants | Zimbabwe | 94.4 /100 | #121 | Exceptional 98.1% |
| Lebanese | 94.2 /100 | #122 | Exceptional 98.1% |
| Immigrants | Japan | 94.1 /100 | #123 | Exceptional 98.1% |
| Menominee | 94.1 /100 | #124 | Exceptional 98.1% |
| Iroquois | 94.1 /100 | #125 | Exceptional 98.1% |
| Syrians | 94.0 /100 | #126 | Exceptional 98.1% |
| Immigrants | Saudi Arabia | 93.6 /100 | #127 | Exceptional 98.1% |
| Immigrants | Serbia | 92.3 /100 | #128 | Exceptional 98.1% |
| Immigrants | Croatia | 92.1 /100 | #129 | Exceptional 98.1% |
| Seminole | 91.1 /100 | #130 | Exceptional 98.0% |
| Immigrants | Europe | 91.1 /100 | #131 | Exceptional 98.0% |
Demographics Similar to Immigrants from Korea by 2nd Grade
In terms of 2nd grade, the demographic groups most similar to Immigrants from Korea are Albanian (97.9%, a difference of 0.0%), Kenyan (97.9%, a difference of 0.0%), Spanish American (97.9%, a difference of 0.010%), Immigrants from Jordan (97.9%, a difference of 0.010%), and Chilean (97.9%, a difference of 0.010%).
| Demographics | Rating | Rank | 2nd Grade |
| Spanish Americans | 56.4 /100 | #165 | Average 97.9% |
| Immigrants | Jordan | 56.3 /100 | #166 | Average 97.9% |
| Chileans | 56.1 /100 | #167 | Average 97.9% |
| Brazilians | 55.8 /100 | #168 | Average 97.9% |
| Immigrants | Spain | 55.4 /100 | #169 | Average 97.9% |
| Navajo | 54.3 /100 | #170 | Average 97.9% |
| Albanians | 52.8 /100 | #171 | Average 97.9% |
| Immigrants | Korea | 52.7 /100 | #172 | Average 97.9% |
| Kenyans | 52.7 /100 | #173 | Average 97.9% |
| Immigrants | Micronesia | 50.0 /100 | #174 | Average 97.9% |
| Immigrants | Bosnia and Herzegovina | 49.8 /100 | #175 | Average 97.9% |
| Immigrants | Sri Lanka | 48.7 /100 | #176 | Average 97.9% |
| Immigrants | Brazil | 46.6 /100 | #177 | Average 97.9% |
| Argentineans | 46.3 /100 | #178 | Average 97.9% |
| Immigrants | Venezuela | 46.1 /100 | #179 | Average 97.9% |