Tlingit-Haida vs Immigrants from Korea 2nd Grade
COMPARE
Tlingit-Haida
Immigrants from Korea
2nd Grade
2nd Grade Comparison
Tlingit-Haida
Immigrants from Korea
98.6%
2ND GRADE
100.0/ 100
METRIC RATING
11th/ 347
METRIC RANK
97.9%
2ND GRADE
52.7/ 100
METRIC RATING
172nd/ 347
METRIC RANK
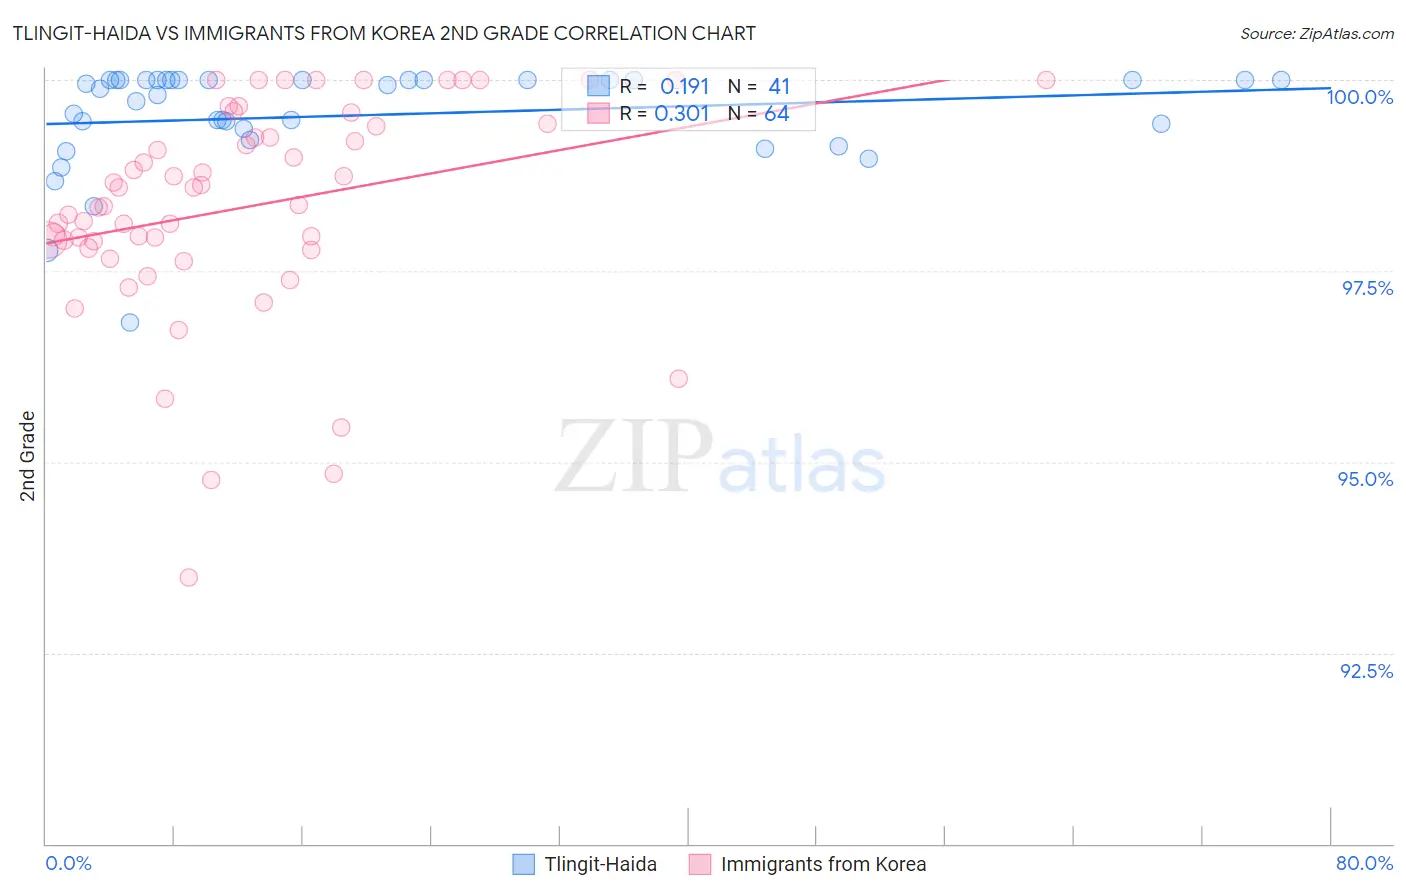
Tlingit-Haida vs Immigrants from Korea 2nd Grade Correlation Chart
The statistical analysis conducted on geographies consisting of 60,865,648 people shows a poor positive correlation between the proportion of Tlingit-Haida and percentage of population with at least 2nd grade education in the United States with a correlation coefficient (R) of 0.191 and weighted average of 98.6%. Similarly, the statistical analysis conducted on geographies consisting of 416,280,076 people shows a mild positive correlation between the proportion of Immigrants from Korea and percentage of population with at least 2nd grade education in the United States with a correlation coefficient (R) of 0.301 and weighted average of 97.9%, a difference of 0.77%.
2nd Grade Correlation Summary
| Measurement | Tlingit-Haida | Immigrants from Korea |
| Minimum | 96.8% | 93.5% |
| Maximum | 100.0% | 100.0% |
| Range | 3.2% | 6.5% |
| Mean | 99.5% | 98.3% |
| Median | 99.9% | 98.5% |
| Interquartile 25% (IQ1) | 99.3% | 97.8% |
| Interquartile 75% (IQ3) | 100.0% | 99.4% |
| Interquartile Range (IQR) | 0.71% | 1.6% |
| Standard Deviation (Sample) | 0.68% | 1.4% |
| Standard Deviation (Population) | 0.67% | 1.4% |
Similar Demographics by 2nd Grade
Demographics Similar to Tlingit-Haida by 2nd Grade
In terms of 2nd grade, the demographic groups most similar to Tlingit-Haida are Slovene (98.6%, a difference of 0.0%), Carpatho Rusyn (98.6%, a difference of 0.010%), English (98.6%, a difference of 0.010%), Swedish (98.6%, a difference of 0.020%), and German (98.7%, a difference of 0.030%).
| Demographics | Rating | Rank | 2nd Grade |
| Tsimshian | 100.0 /100 | #4 | Exceptional 98.8% |
| Alaskan Athabascans | 100.0 /100 | #5 | Exceptional 98.7% |
| Alaska Natives | 100.0 /100 | #6 | Exceptional 98.7% |
| Norwegians | 100.0 /100 | #7 | Exceptional 98.7% |
| Germans | 100.0 /100 | #8 | Exceptional 98.7% |
| Slovaks | 100.0 /100 | #9 | Exceptional 98.7% |
| Slovenes | 100.0 /100 | #10 | Exceptional 98.6% |
| Tlingit-Haida | 100.0 /100 | #11 | Exceptional 98.6% |
| Carpatho Rusyns | 100.0 /100 | #12 | Exceptional 98.6% |
| English | 100.0 /100 | #13 | Exceptional 98.6% |
| Swedes | 100.0 /100 | #14 | Exceptional 98.6% |
| Scottish | 100.0 /100 | #15 | Exceptional 98.6% |
| Dutch | 100.0 /100 | #16 | Exceptional 98.6% |
| Aleuts | 100.0 /100 | #17 | Exceptional 98.6% |
| Irish | 100.0 /100 | #18 | Exceptional 98.6% |
Demographics Similar to Immigrants from Korea by 2nd Grade
In terms of 2nd grade, the demographic groups most similar to Immigrants from Korea are Albanian (97.9%, a difference of 0.0%), Kenyan (97.9%, a difference of 0.0%), Spanish American (97.9%, a difference of 0.010%), Immigrants from Jordan (97.9%, a difference of 0.010%), and Chilean (97.9%, a difference of 0.010%).
| Demographics | Rating | Rank | 2nd Grade |
| Spanish Americans | 56.4 /100 | #165 | Average 97.9% |
| Immigrants | Jordan | 56.3 /100 | #166 | Average 97.9% |
| Chileans | 56.1 /100 | #167 | Average 97.9% |
| Brazilians | 55.8 /100 | #168 | Average 97.9% |
| Immigrants | Spain | 55.4 /100 | #169 | Average 97.9% |
| Navajo | 54.3 /100 | #170 | Average 97.9% |
| Albanians | 52.8 /100 | #171 | Average 97.9% |
| Immigrants | Korea | 52.7 /100 | #172 | Average 97.9% |
| Kenyans | 52.7 /100 | #173 | Average 97.9% |
| Immigrants | Micronesia | 50.0 /100 | #174 | Average 97.9% |
| Immigrants | Bosnia and Herzegovina | 49.8 /100 | #175 | Average 97.9% |
| Immigrants | Sri Lanka | 48.7 /100 | #176 | Average 97.9% |
| Immigrants | Brazil | 46.6 /100 | #177 | Average 97.9% |
| Argentineans | 46.3 /100 | #178 | Average 97.9% |
| Immigrants | Venezuela | 46.1 /100 | #179 | Average 97.9% |