Maltese vs Immigrants from Korea 2nd Grade
COMPARE
Maltese
Immigrants from Korea
2nd Grade
2nd Grade Comparison
Maltese
Immigrants from Korea
98.3%
2ND GRADE
99.7/ 100
METRIC RATING
63rd/ 347
METRIC RANK
97.9%
2ND GRADE
52.7/ 100
METRIC RATING
172nd/ 347
METRIC RANK
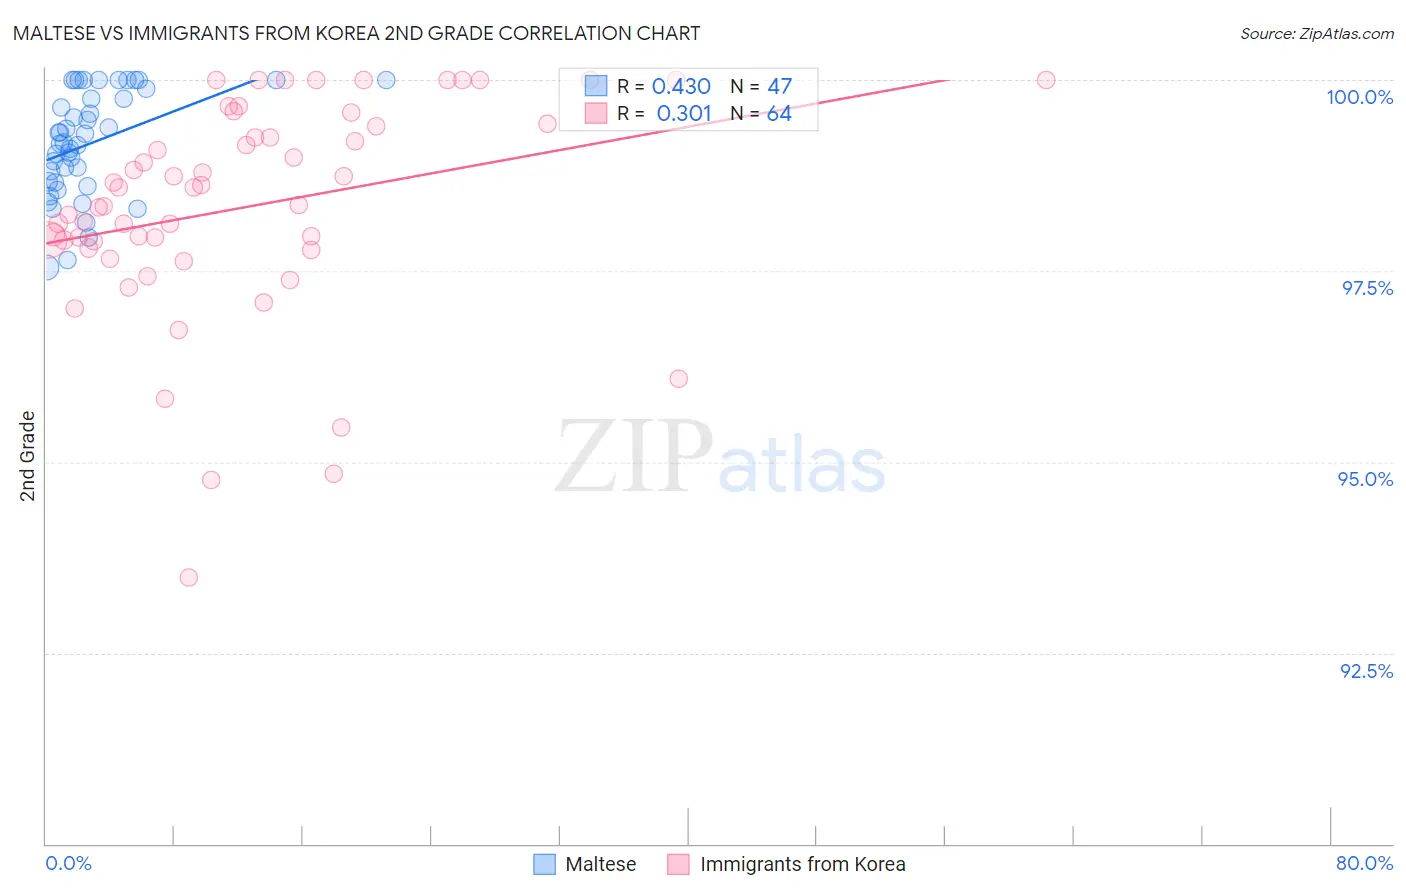
Maltese vs Immigrants from Korea 2nd Grade Correlation Chart
The statistical analysis conducted on geographies consisting of 126,476,608 people shows a moderate positive correlation between the proportion of Maltese and percentage of population with at least 2nd grade education in the United States with a correlation coefficient (R) of 0.430 and weighted average of 98.3%. Similarly, the statistical analysis conducted on geographies consisting of 416,280,076 people shows a mild positive correlation between the proportion of Immigrants from Korea and percentage of population with at least 2nd grade education in the United States with a correlation coefficient (R) of 0.301 and weighted average of 97.9%, a difference of 0.46%.
2nd Grade Correlation Summary
| Measurement | Maltese | Immigrants from Korea |
| Minimum | 97.5% | 93.5% |
| Maximum | 100.0% | 100.0% |
| Range | 2.5% | 6.5% |
| Mean | 99.2% | 98.3% |
| Median | 99.2% | 98.5% |
| Interquartile 25% (IQ1) | 98.7% | 97.8% |
| Interquartile 75% (IQ3) | 99.9% | 99.4% |
| Interquartile Range (IQR) | 1.2% | 1.6% |
| Standard Deviation (Sample) | 0.69% | 1.4% |
| Standard Deviation (Population) | 0.68% | 1.4% |
Similar Demographics by 2nd Grade
Demographics Similar to Maltese by 2nd Grade
In terms of 2nd grade, the demographic groups most similar to Maltese are Creek (98.3%, a difference of 0.0%), Immigrants from Canada (98.3%, a difference of 0.0%), Greek (98.3%, a difference of 0.0%), Immigrants from North America (98.3%, a difference of 0.0%), and American (98.3%, a difference of 0.010%).
| Demographics | Rating | Rank | 2nd Grade |
| Americans | 99.8 /100 | #56 | Exceptional 98.3% |
| Austrians | 99.8 /100 | #57 | Exceptional 98.3% |
| Bulgarians | 99.8 /100 | #58 | Exceptional 98.3% |
| Slavs | 99.8 /100 | #59 | Exceptional 98.3% |
| Creek | 99.8 /100 | #60 | Exceptional 98.3% |
| Immigrants | Canada | 99.8 /100 | #61 | Exceptional 98.3% |
| Greeks | 99.8 /100 | #62 | Exceptional 98.3% |
| Maltese | 99.7 /100 | #63 | Exceptional 98.3% |
| Immigrants | North America | 99.7 /100 | #64 | Exceptional 98.3% |
| New Zealanders | 99.7 /100 | #65 | Exceptional 98.3% |
| Canadians | 99.7 /100 | #66 | Exceptional 98.3% |
| Immigrants | Northern Europe | 99.7 /100 | #67 | Exceptional 98.3% |
| Russians | 99.7 /100 | #68 | Exceptional 98.3% |
| Immigrants | Austria | 99.6 /100 | #69 | Exceptional 98.3% |
| Serbians | 99.6 /100 | #70 | Exceptional 98.3% |
Demographics Similar to Immigrants from Korea by 2nd Grade
In terms of 2nd grade, the demographic groups most similar to Immigrants from Korea are Albanian (97.9%, a difference of 0.0%), Kenyan (97.9%, a difference of 0.0%), Spanish American (97.9%, a difference of 0.010%), Immigrants from Jordan (97.9%, a difference of 0.010%), and Chilean (97.9%, a difference of 0.010%).
| Demographics | Rating | Rank | 2nd Grade |
| Spanish Americans | 56.4 /100 | #165 | Average 97.9% |
| Immigrants | Jordan | 56.3 /100 | #166 | Average 97.9% |
| Chileans | 56.1 /100 | #167 | Average 97.9% |
| Brazilians | 55.8 /100 | #168 | Average 97.9% |
| Immigrants | Spain | 55.4 /100 | #169 | Average 97.9% |
| Navajo | 54.3 /100 | #170 | Average 97.9% |
| Albanians | 52.8 /100 | #171 | Average 97.9% |
| Immigrants | Korea | 52.7 /100 | #172 | Average 97.9% |
| Kenyans | 52.7 /100 | #173 | Average 97.9% |
| Immigrants | Micronesia | 50.0 /100 | #174 | Average 97.9% |
| Immigrants | Bosnia and Herzegovina | 49.8 /100 | #175 | Average 97.9% |
| Immigrants | Sri Lanka | 48.7 /100 | #176 | Average 97.9% |
| Immigrants | Brazil | 46.6 /100 | #177 | Average 97.9% |
| Argentineans | 46.3 /100 | #178 | Average 97.9% |
| Immigrants | Venezuela | 46.1 /100 | #179 | Average 97.9% |