Cape Verdean vs Immigrants from Korea 2nd Grade
COMPARE
Cape Verdean
Immigrants from Korea
2nd Grade
2nd Grade Comparison
Cape Verdeans
Immigrants from Korea
96.8%
2ND GRADE
0.0/ 100
METRIC RATING
312th/ 347
METRIC RANK
97.9%
2ND GRADE
52.7/ 100
METRIC RATING
172nd/ 347
METRIC RANK
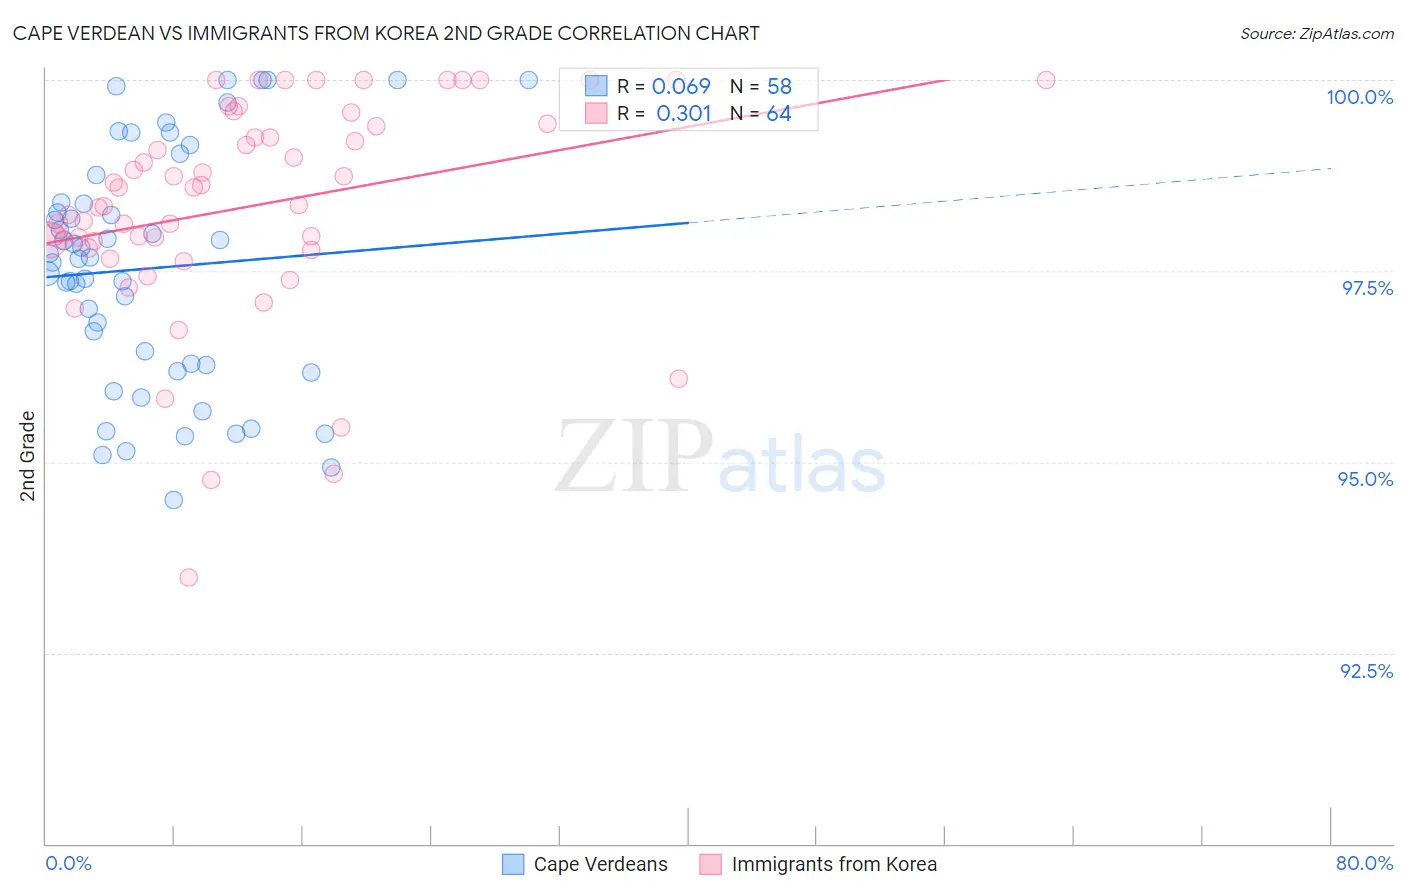
Cape Verdean vs Immigrants from Korea 2nd Grade Correlation Chart
The statistical analysis conducted on geographies consisting of 107,537,955 people shows a slight positive correlation between the proportion of Cape Verdeans and percentage of population with at least 2nd grade education in the United States with a correlation coefficient (R) of 0.069 and weighted average of 96.8%. Similarly, the statistical analysis conducted on geographies consisting of 416,280,076 people shows a mild positive correlation between the proportion of Immigrants from Korea and percentage of population with at least 2nd grade education in the United States with a correlation coefficient (R) of 0.301 and weighted average of 97.9%, a difference of 1.1%.
2nd Grade Correlation Summary
| Measurement | Cape Verdean | Immigrants from Korea |
| Minimum | 94.5% | 93.5% |
| Maximum | 100.0% | 100.0% |
| Range | 5.5% | 6.5% |
| Mean | 97.5% | 98.3% |
| Median | 97.7% | 98.5% |
| Interquartile 25% (IQ1) | 96.3% | 97.8% |
| Interquartile 75% (IQ3) | 98.4% | 99.4% |
| Interquartile Range (IQR) | 2.1% | 1.6% |
| Standard Deviation (Sample) | 1.5% | 1.4% |
| Standard Deviation (Population) | 1.5% | 1.4% |
Similar Demographics by 2nd Grade
Demographics Similar to Cape Verdeans by 2nd Grade
In terms of 2nd grade, the demographic groups most similar to Cape Verdeans are Sri Lankan (96.8%, a difference of 0.010%), Guyanese (96.8%, a difference of 0.010%), Immigrants from Haiti (96.8%, a difference of 0.020%), Belizean (96.8%, a difference of 0.020%), and Hispanic or Latino (96.8%, a difference of 0.020%).
| Demographics | Rating | Rank | 2nd Grade |
| Nicaraguans | 0.0 /100 | #305 | Tragic 96.9% |
| Immigrants | Somalia | 0.0 /100 | #306 | Tragic 96.9% |
| Immigrants | Azores | 0.0 /100 | #307 | Tragic 96.8% |
| Immigrants | Haiti | 0.0 /100 | #308 | Tragic 96.8% |
| Belizeans | 0.0 /100 | #309 | Tragic 96.8% |
| Sri Lankans | 0.0 /100 | #310 | Tragic 96.8% |
| Guyanese | 0.0 /100 | #311 | Tragic 96.8% |
| Cape Verdeans | 0.0 /100 | #312 | Tragic 96.8% |
| Hispanics or Latinos | 0.0 /100 | #313 | Tragic 96.8% |
| Immigrants | Ecuador | 0.0 /100 | #314 | Tragic 96.8% |
| Immigrants | Belize | 0.0 /100 | #315 | Tragic 96.8% |
| Hondurans | 0.0 /100 | #316 | Tragic 96.7% |
| Immigrants | Laos | 0.0 /100 | #317 | Tragic 96.7% |
| Indonesians | 0.0 /100 | #318 | Tragic 96.7% |
| Immigrants | Nicaragua | 0.0 /100 | #319 | Tragic 96.7% |
Demographics Similar to Immigrants from Korea by 2nd Grade
In terms of 2nd grade, the demographic groups most similar to Immigrants from Korea are Albanian (97.9%, a difference of 0.0%), Kenyan (97.9%, a difference of 0.0%), Spanish American (97.9%, a difference of 0.010%), Immigrants from Jordan (97.9%, a difference of 0.010%), and Chilean (97.9%, a difference of 0.010%).
| Demographics | Rating | Rank | 2nd Grade |
| Spanish Americans | 56.4 /100 | #165 | Average 97.9% |
| Immigrants | Jordan | 56.3 /100 | #166 | Average 97.9% |
| Chileans | 56.1 /100 | #167 | Average 97.9% |
| Brazilians | 55.8 /100 | #168 | Average 97.9% |
| Immigrants | Spain | 55.4 /100 | #169 | Average 97.9% |
| Navajo | 54.3 /100 | #170 | Average 97.9% |
| Albanians | 52.8 /100 | #171 | Average 97.9% |
| Immigrants | Korea | 52.7 /100 | #172 | Average 97.9% |
| Kenyans | 52.7 /100 | #173 | Average 97.9% |
| Immigrants | Micronesia | 50.0 /100 | #174 | Average 97.9% |
| Immigrants | Bosnia and Herzegovina | 49.8 /100 | #175 | Average 97.9% |
| Immigrants | Sri Lanka | 48.7 /100 | #176 | Average 97.9% |
| Immigrants | Brazil | 46.6 /100 | #177 | Average 97.9% |
| Argentineans | 46.3 /100 | #178 | Average 97.9% |
| Immigrants | Venezuela | 46.1 /100 | #179 | Average 97.9% |