Salvadoran vs Cherokee Master's Degree
COMPARE
Salvadoran
Cherokee
Master's Degree
Master's Degree Comparison
Salvadorans
Cherokee
12.2%
MASTER'S DEGREE
0.3/ 100
METRIC RATING
270th/ 347
METRIC RANK
11.4%
MASTER'S DEGREE
0.1/ 100
METRIC RATING
302nd/ 347
METRIC RANK
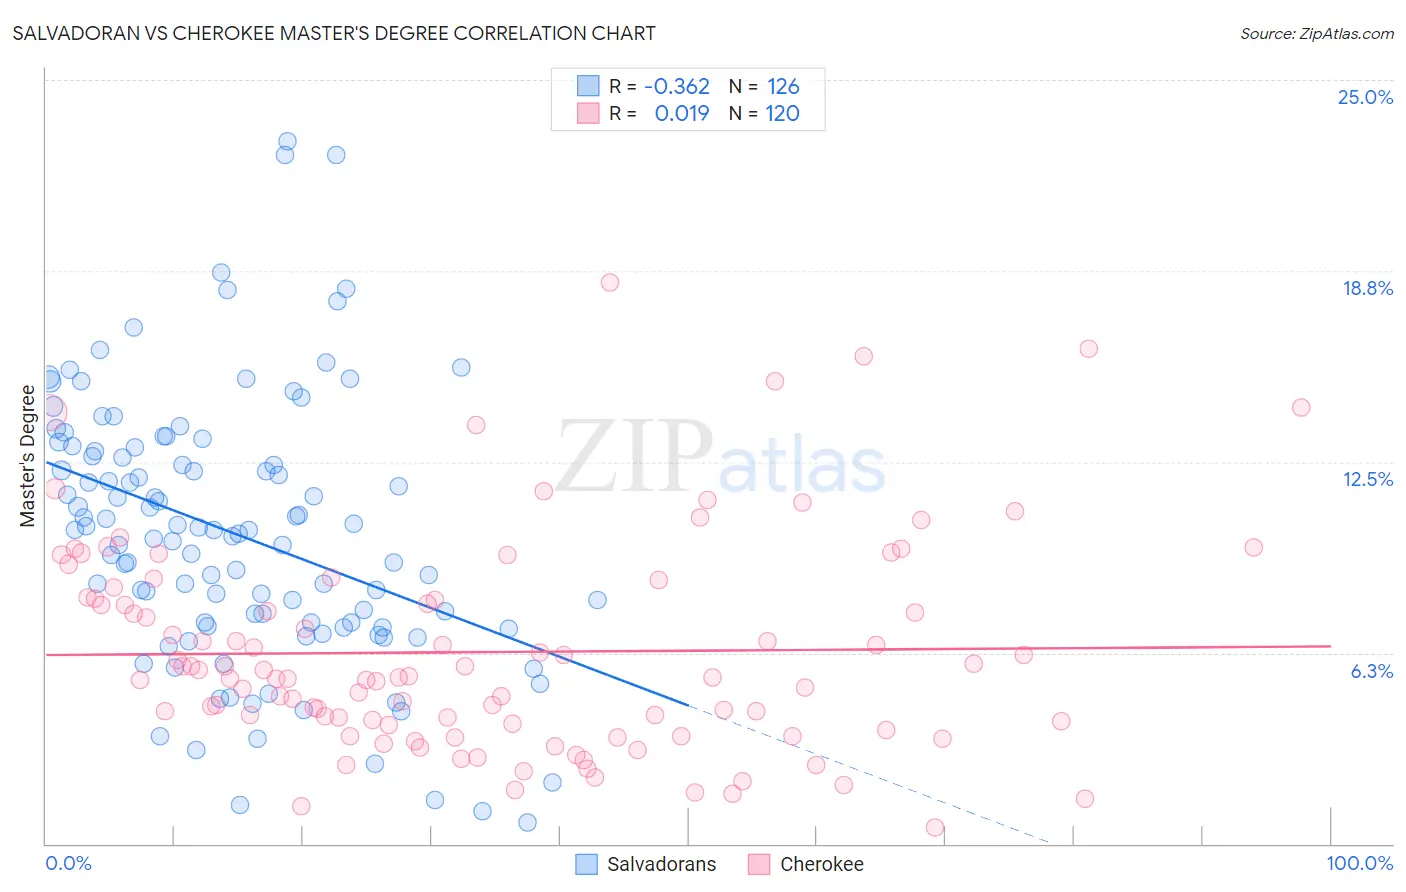
Salvadoran vs Cherokee Master's Degree Correlation Chart
The statistical analysis conducted on geographies consisting of 398,764,232 people shows a mild negative correlation between the proportion of Salvadorans and percentage of population with at least master's degree education in the United States with a correlation coefficient (R) of -0.362 and weighted average of 12.2%. Similarly, the statistical analysis conducted on geographies consisting of 493,264,146 people shows no correlation between the proportion of Cherokee and percentage of population with at least master's degree education in the United States with a correlation coefficient (R) of 0.019 and weighted average of 11.4%, a difference of 7.1%.
Master's Degree Correlation Summary
| Measurement | Salvadoran | Cherokee |
| Minimum | 0.69% | 0.55% |
| Maximum | 23.0% | 18.4% |
| Range | 22.3% | 17.8% |
| Mean | 10.1% | 6.3% |
| Median | 10.2% | 5.4% |
| Interquartile 25% (IQ1) | 7.1% | 3.9% |
| Interquartile 75% (IQ3) | 12.9% | 8.0% |
| Interquartile Range (IQR) | 5.7% | 4.1% |
| Standard Deviation (Sample) | 4.4% | 3.5% |
| Standard Deviation (Population) | 4.4% | 3.4% |
Similar Demographics by Master's Degree
Demographics Similar to Salvadorans by Master's Degree
In terms of master's degree, the demographic groups most similar to Salvadorans are Central American (12.2%, a difference of 0.13%), Haitian (12.1%, a difference of 0.59%), Comanche (12.1%, a difference of 0.64%), Blackfeet (12.1%, a difference of 0.74%), and Native Hawaiian (12.3%, a difference of 0.78%).
| Demographics | Rating | Rank | Master's Degree |
| Central American Indians | 0.5 /100 | #263 | Tragic 12.4% |
| Belizeans | 0.5 /100 | #264 | Tragic 12.4% |
| Immigrants | Fiji | 0.5 /100 | #265 | Tragic 12.4% |
| Bahamians | 0.5 /100 | #266 | Tragic 12.4% |
| Americans | 0.4 /100 | #267 | Tragic 12.3% |
| Native Hawaiians | 0.4 /100 | #268 | Tragic 12.3% |
| Central Americans | 0.3 /100 | #269 | Tragic 12.2% |
| Salvadorans | 0.3 /100 | #270 | Tragic 12.2% |
| Haitians | 0.3 /100 | #271 | Tragic 12.1% |
| Comanche | 0.3 /100 | #272 | Tragic 12.1% |
| Blackfeet | 0.3 /100 | #273 | Tragic 12.1% |
| Cape Verdeans | 0.3 /100 | #274 | Tragic 12.1% |
| Cubans | 0.3 /100 | #275 | Tragic 12.1% |
| Blacks/African Americans | 0.3 /100 | #276 | Tragic 12.1% |
| Immigrants | Caribbean | 0.3 /100 | #277 | Tragic 12.1% |
Demographics Similar to Cherokee by Master's Degree
In terms of master's degree, the demographic groups most similar to Cherokee are Immigrants from Laos (11.4%, a difference of 0.020%), Immigrants from Cabo Verde (11.3%, a difference of 0.21%), Tsimshian (11.4%, a difference of 0.31%), Chippewa (11.4%, a difference of 0.47%), and Chickasaw (11.4%, a difference of 0.49%).
| Demographics | Rating | Rank | Master's Degree |
| Marshallese | 0.1 /100 | #295 | Tragic 11.6% |
| Alaskan Athabascans | 0.1 /100 | #296 | Tragic 11.6% |
| Immigrants | Yemen | 0.1 /100 | #297 | Tragic 11.6% |
| Samoans | 0.1 /100 | #298 | Tragic 11.5% |
| Chickasaw | 0.1 /100 | #299 | Tragic 11.4% |
| Chippewa | 0.1 /100 | #300 | Tragic 11.4% |
| Tsimshian | 0.1 /100 | #301 | Tragic 11.4% |
| Cherokee | 0.1 /100 | #302 | Tragic 11.4% |
| Immigrants | Laos | 0.1 /100 | #303 | Tragic 11.4% |
| Immigrants | Cabo Verde | 0.1 /100 | #304 | Tragic 11.3% |
| Immigrants | Latin America | 0.0 /100 | #305 | Tragic 11.3% |
| Mexican American Indians | 0.0 /100 | #306 | Tragic 11.2% |
| Cheyenne | 0.0 /100 | #307 | Tragic 11.2% |
| Puerto Ricans | 0.0 /100 | #308 | Tragic 11.2% |
| Puget Sound Salish | 0.0 /100 | #309 | Tragic 11.1% |