Menominee vs Cherokee Householder Income Over 65 years
COMPARE
Menominee
Cherokee
Householder Income Over 65 years
Householder Income Over 65 years Comparison
Menominee
Cherokee
$51,719
HOUSEHOLDER INCOME OVER 65 YEARS
0.0/ 100
METRIC RATING
321st/ 347
METRIC RANK
$54,133
HOUSEHOLDER INCOME OVER 65 YEARS
0.1/ 100
METRIC RATING
275th/ 347
METRIC RANK
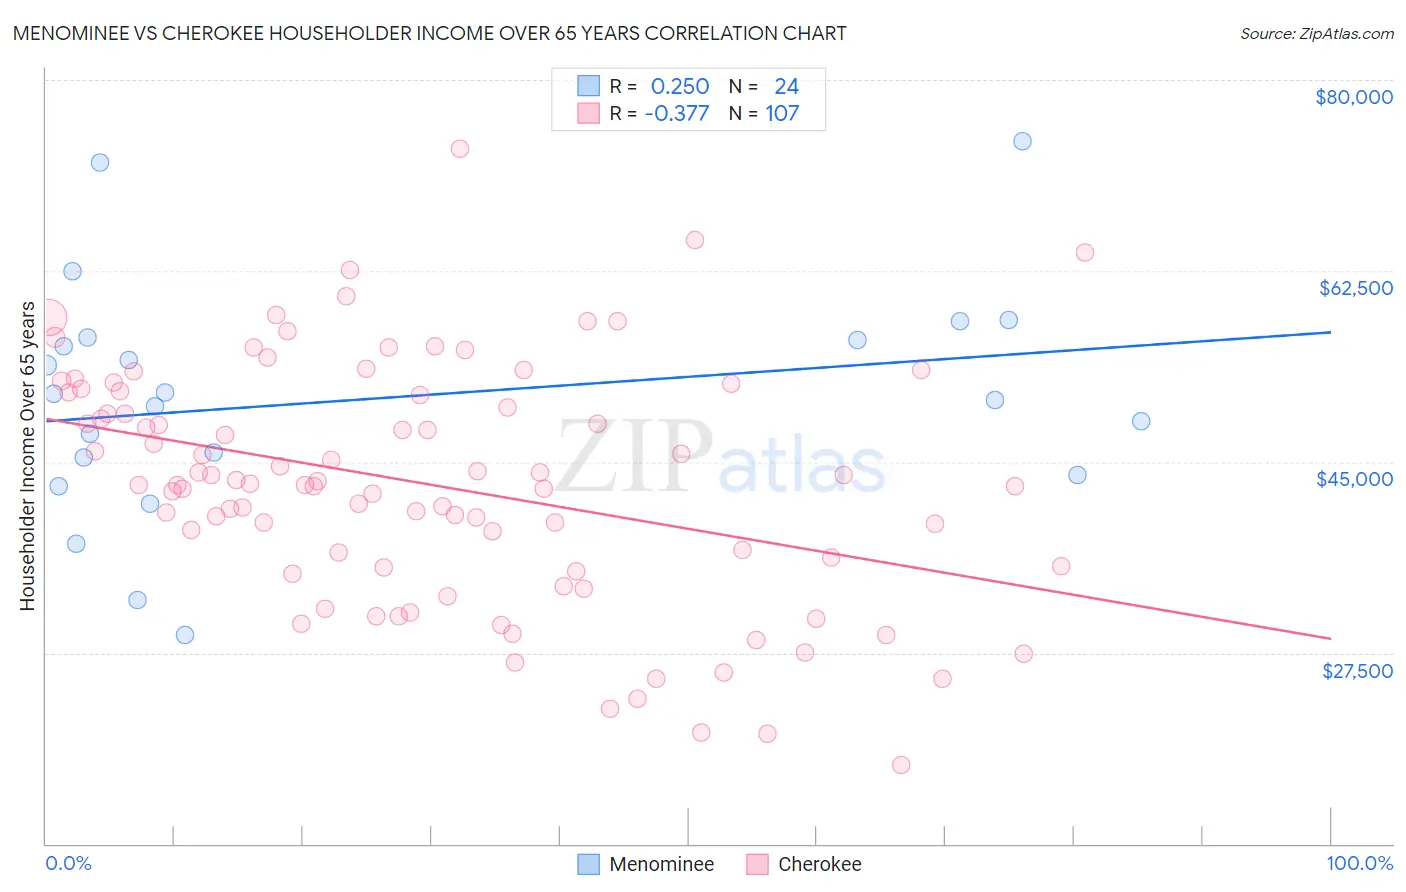
Menominee vs Cherokee Householder Income Over 65 years Correlation Chart
The statistical analysis conducted on geographies consisting of 45,767,067 people shows a weak positive correlation between the proportion of Menominee and household income with householder over the age of 65 in the United States with a correlation coefficient (R) of 0.250 and weighted average of $51,719. Similarly, the statistical analysis conducted on geographies consisting of 490,908,183 people shows a mild negative correlation between the proportion of Cherokee and household income with householder over the age of 65 in the United States with a correlation coefficient (R) of -0.377 and weighted average of $54,133, a difference of 4.7%.
Householder Income Over 65 years Correlation Summary
| Measurement | Menominee | Cherokee |
| Minimum | $29,125 | $17,188 |
| Maximum | $74,432 | $73,750 |
| Range | $45,307 | $56,562 |
| Mean | $50,793 | $42,917 |
| Median | $50,939 | $42,899 |
| Interquartile 25% (IQ1) | $44,602 | $35,369 |
| Interquartile 75% (IQ3) | $56,259 | $51,355 |
| Interquartile Range (IQR) | $11,657 | $15,986 |
| Standard Deviation (Sample) | $10,695 | $10,957 |
| Standard Deviation (Population) | $10,470 | $10,906 |
Similar Demographics by Householder Income Over 65 years
Demographics Similar to Menominee by Householder Income Over 65 years
In terms of householder income over 65 years, the demographic groups most similar to Menominee are Colville ($51,739, a difference of 0.040%), Immigrants from Honduras ($51,888, a difference of 0.33%), Haitian ($51,912, a difference of 0.37%), Immigrants from St. Vincent and the Grenadines ($51,922, a difference of 0.39%), and Creek ($51,949, a difference of 0.45%).
| Demographics | Rating | Rank | Householder Income Over 65 years |
| Natives/Alaskans | 0.0 /100 | #314 | Tragic $52,081 |
| U.S. Virgin Islanders | 0.0 /100 | #315 | Tragic $52,072 |
| Creek | 0.0 /100 | #316 | Tragic $51,949 |
| Immigrants | St. Vincent and the Grenadines | 0.0 /100 | #317 | Tragic $51,922 |
| Haitians | 0.0 /100 | #318 | Tragic $51,912 |
| Immigrants | Honduras | 0.0 /100 | #319 | Tragic $51,888 |
| Colville | 0.0 /100 | #320 | Tragic $51,739 |
| Menominee | 0.0 /100 | #321 | Tragic $51,719 |
| British West Indians | 0.0 /100 | #322 | Tragic $51,463 |
| Cajuns | 0.0 /100 | #323 | Tragic $51,397 |
| Immigrants | Congo | 0.0 /100 | #324 | Tragic $51,393 |
| Immigrants | Haiti | 0.0 /100 | #325 | Tragic $51,219 |
| Kiowa | 0.0 /100 | #326 | Tragic $51,140 |
| Bahamians | 0.0 /100 | #327 | Tragic $51,000 |
| Hopi | 0.0 /100 | #328 | Tragic $50,925 |
Demographics Similar to Cherokee by Householder Income Over 65 years
In terms of householder income over 65 years, the demographic groups most similar to Cherokee are Cree ($54,129, a difference of 0.010%), Barbadian ($54,163, a difference of 0.060%), Cheyenne ($54,096, a difference of 0.070%), Indonesian ($54,176, a difference of 0.080%), and Potawatomi ($54,212, a difference of 0.15%).
| Demographics | Rating | Rank | Householder Income Over 65 years |
| Immigrants | Zaire | 0.1 /100 | #268 | Tragic $54,512 |
| Nicaraguans | 0.1 /100 | #269 | Tragic $54,474 |
| Immigrants | Senegal | 0.1 /100 | #270 | Tragic $54,447 |
| Liberians | 0.1 /100 | #271 | Tragic $54,356 |
| Potawatomi | 0.1 /100 | #272 | Tragic $54,212 |
| Indonesians | 0.1 /100 | #273 | Tragic $54,176 |
| Barbadians | 0.1 /100 | #274 | Tragic $54,163 |
| Cherokee | 0.1 /100 | #275 | Tragic $54,133 |
| Cree | 0.1 /100 | #276 | Tragic $54,129 |
| Cheyenne | 0.1 /100 | #277 | Tragic $54,096 |
| Immigrants | Ecuador | 0.1 /100 | #278 | Tragic $54,030 |
| Blackfeet | 0.1 /100 | #279 | Tragic $54,029 |
| Immigrants | Jamaica | 0.1 /100 | #280 | Tragic $54,027 |
| Somalis | 0.1 /100 | #281 | Tragic $54,004 |
| Immigrants | Armenia | 0.1 /100 | #282 | Tragic $53,974 |