Immigrants from Panama vs Vietnamese Associate's Degree
COMPARE
Immigrants from Panama
Vietnamese
Associate's Degree
Associate's Degree Comparison
Immigrants from Panama
Vietnamese
44.7%
ASSOCIATE'S DEGREE
12.4/ 100
METRIC RATING
215th/ 347
METRIC RANK
45.8%
ASSOCIATE'S DEGREE
34.0/ 100
METRIC RATING
190th/ 347
METRIC RANK
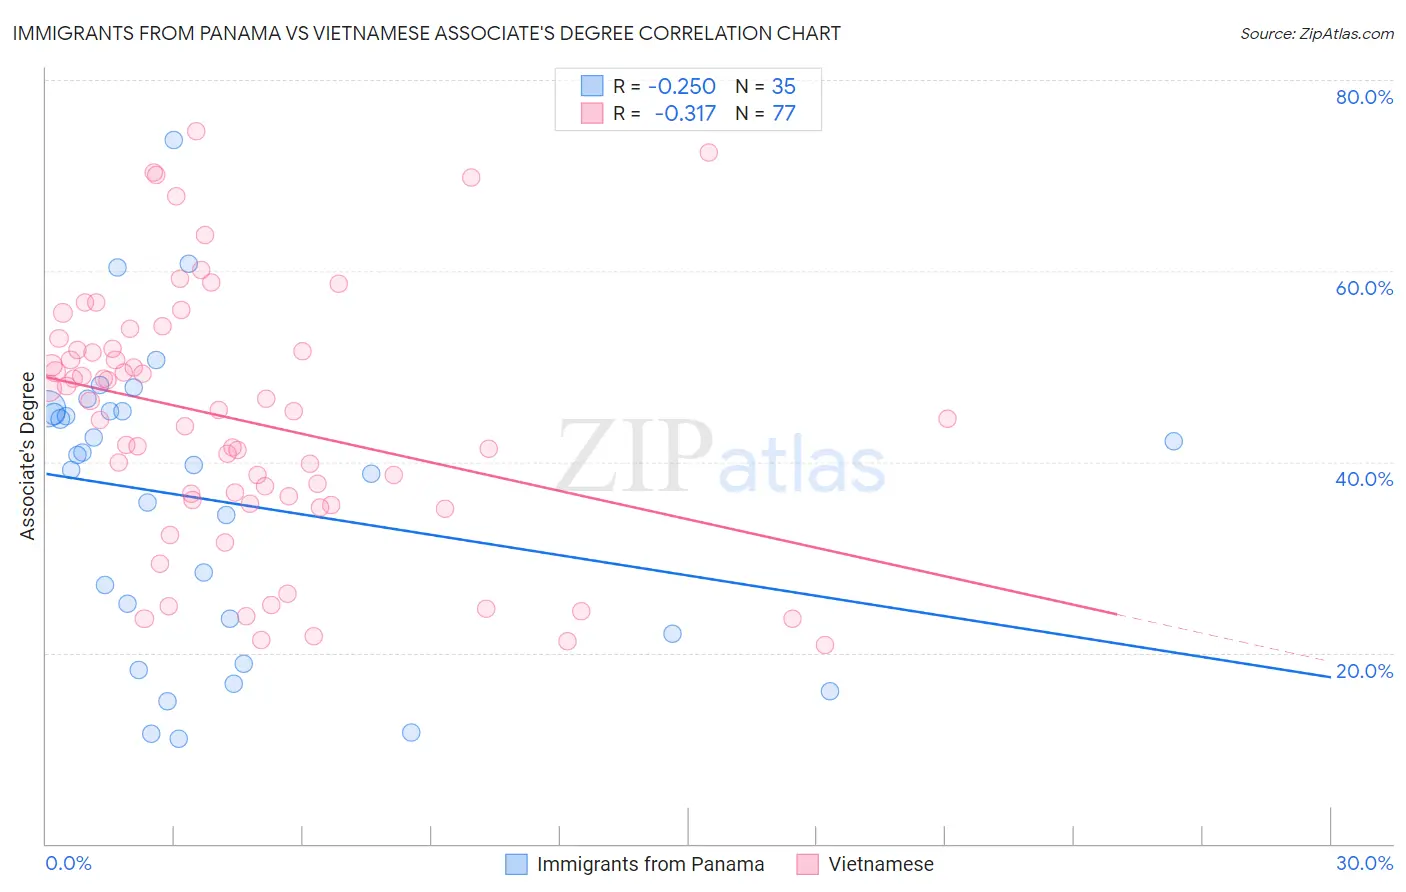
Immigrants from Panama vs Vietnamese Associate's Degree Correlation Chart
The statistical analysis conducted on geographies consisting of 221,180,588 people shows a weak negative correlation between the proportion of Immigrants from Panama and percentage of population with at least associate's degree education in the United States with a correlation coefficient (R) of -0.250 and weighted average of 44.7%. Similarly, the statistical analysis conducted on geographies consisting of 170,748,641 people shows a mild negative correlation between the proportion of Vietnamese and percentage of population with at least associate's degree education in the United States with a correlation coefficient (R) of -0.317 and weighted average of 45.8%, a difference of 2.5%.
Associate's Degree Correlation Summary
| Measurement | Immigrants from Panama | Vietnamese |
| Minimum | 11.1% | 20.8% |
| Maximum | 73.8% | 74.6% |
| Range | 62.7% | 53.9% |
| Mean | 35.9% | 44.4% |
| Median | 39.6% | 45.3% |
| Interquartile 25% (IQ1) | 22.0% | 35.8% |
| Interquartile 75% (IQ3) | 45.4% | 51.8% |
| Interquartile Range (IQR) | 23.4% | 16.0% |
| Standard Deviation (Sample) | 15.5% | 13.3% |
| Standard Deviation (Population) | 15.3% | 13.2% |
Similar Demographics by Associate's Degree
Demographics Similar to Immigrants from Panama by Associate's Degree
In terms of associate's degree, the demographic groups most similar to Immigrants from Panama are Immigrants from Middle Africa (44.7%, a difference of 0.060%), Immigrants from Nigeria (44.6%, a difference of 0.18%), Immigrants from Ghana (44.8%, a difference of 0.31%), Immigrants (44.5%, a difference of 0.37%), and French Canadian (44.9%, a difference of 0.43%).
| Demographics | Rating | Rank | Associate's Degree |
| Dutch | 17.6 /100 | #208 | Poor 45.0% |
| Immigrants | Costa Rica | 16.7 /100 | #209 | Poor 45.0% |
| Immigrants | Philippines | 16.7 /100 | #210 | Poor 45.0% |
| Immigrants | Zaire | 16.6 /100 | #211 | Poor 45.0% |
| French Canadians | 15.0 /100 | #212 | Poor 44.9% |
| Immigrants | Ghana | 14.2 /100 | #213 | Poor 44.8% |
| Immigrants | Middle Africa | 12.7 /100 | #214 | Poor 44.7% |
| Immigrants | Panama | 12.4 /100 | #215 | Poor 44.7% |
| Immigrants | Nigeria | 11.4 /100 | #216 | Poor 44.6% |
| Immigrants | Immigrants | 10.5 /100 | #217 | Poor 44.5% |
| Spanish | 9.4 /100 | #218 | Tragic 44.4% |
| Whites/Caucasians | 7.5 /100 | #219 | Tragic 44.2% |
| Portuguese | 7.2 /100 | #220 | Tragic 44.1% |
| Immigrants | Western Africa | 6.6 /100 | #221 | Tragic 44.1% |
| Barbadians | 5.8 /100 | #222 | Tragic 43.9% |
Demographics Similar to Vietnamese by Associate's Degree
In terms of associate's degree, the demographic groups most similar to Vietnamese are Korean (45.8%, a difference of 0.020%), Immigrants from Oceania (45.8%, a difference of 0.060%), Celtic (45.8%, a difference of 0.060%), Immigrants from Uruguay (45.8%, a difference of 0.12%), and Ghanaian (45.8%, a difference of 0.12%).
| Demographics | Rating | Rank | Associate's Degree |
| Yugoslavians | 40.2 /100 | #183 | Average 46.0% |
| Czechoslovakians | 40.0 /100 | #184 | Average 46.0% |
| Costa Ricans | 38.6 /100 | #185 | Fair 46.0% |
| Welsh | 37.9 /100 | #186 | Fair 45.9% |
| Immigrants | Uruguay | 35.5 /100 | #187 | Fair 45.8% |
| Ghanaians | 35.5 /100 | #188 | Fair 45.8% |
| Immigrants | Oceania | 34.7 /100 | #189 | Fair 45.8% |
| Vietnamese | 34.0 /100 | #190 | Fair 45.8% |
| Koreans | 33.8 /100 | #191 | Fair 45.8% |
| Celtics | 33.3 /100 | #192 | Fair 45.8% |
| Immigrants | Cameroon | 31.0 /100 | #193 | Fair 45.7% |
| Immigrants | Peru | 27.6 /100 | #194 | Fair 45.5% |
| Germans | 26.5 /100 | #195 | Fair 45.5% |
| French | 25.6 /100 | #196 | Fair 45.4% |
| Scotch-Irish | 22.3 /100 | #197 | Fair 45.3% |