Marshallese vs Kenyan 2nd Grade
COMPARE
Marshallese
Kenyan
2nd Grade
2nd Grade Comparison
Marshallese
Kenyans
97.9%
2ND GRADE
67.7/ 100
METRIC RATING
154th/ 347
METRIC RANK
97.9%
2ND GRADE
52.7/ 100
METRIC RATING
173rd/ 347
METRIC RANK
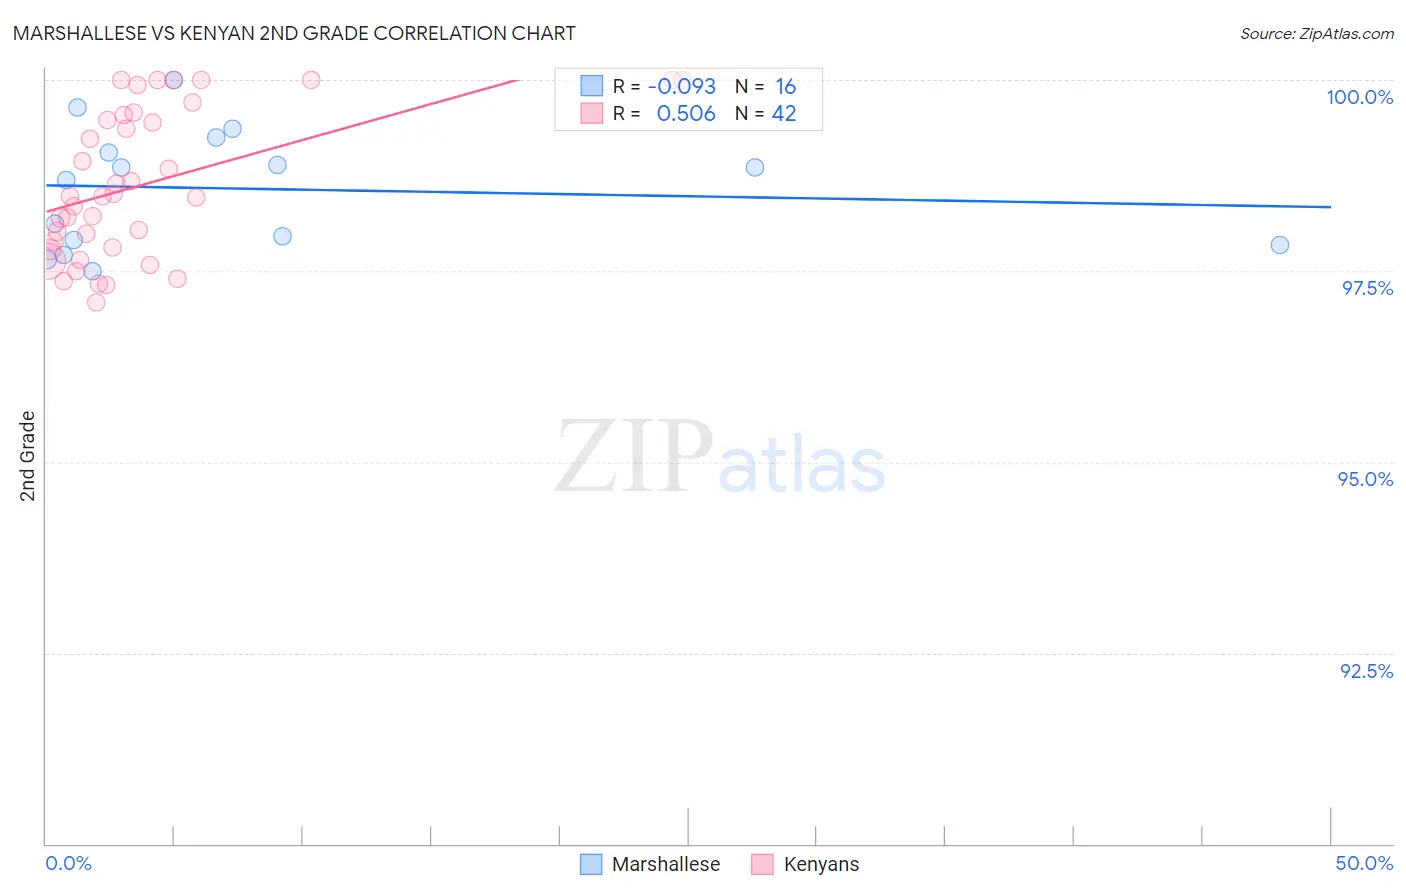
Marshallese vs Kenyan 2nd Grade Correlation Chart
The statistical analysis conducted on geographies consisting of 14,761,315 people shows a slight negative correlation between the proportion of Marshallese and percentage of population with at least 2nd grade education in the United States with a correlation coefficient (R) of -0.093 and weighted average of 97.9%. Similarly, the statistical analysis conducted on geographies consisting of 168,244,481 people shows a substantial positive correlation between the proportion of Kenyans and percentage of population with at least 2nd grade education in the United States with a correlation coefficient (R) of 0.506 and weighted average of 97.9%, a difference of 0.050%.
2nd Grade Correlation Summary
| Measurement | Marshallese | Kenyan |
| Minimum | 97.5% | 97.1% |
| Maximum | 100.0% | 100.0% |
| Range | 2.5% | 2.9% |
| Mean | 98.6% | 98.6% |
| Median | 98.8% | 98.5% |
| Interquartile 25% (IQ1) | 97.9% | 97.8% |
| Interquartile 75% (IQ3) | 99.1% | 99.5% |
| Interquartile Range (IQR) | 1.3% | 1.7% |
| Standard Deviation (Sample) | 0.78% | 0.95% |
| Standard Deviation (Population) | 0.75% | 0.94% |
Demographics Similar to Marshallese and Kenyans by 2nd Grade
In terms of 2nd grade, the demographic groups most similar to Marshallese are Immigrants from South Central Asia (97.9%, a difference of 0.0%), French American Indian (97.9%, a difference of 0.010%), Dutch West Indian (97.9%, a difference of 0.010%), Venezuelan (97.9%, a difference of 0.020%), and Immigrants from Iran (97.9%, a difference of 0.020%). Similarly, the demographic groups most similar to Kenyans are Albanian (97.9%, a difference of 0.0%), Immigrants from Korea (97.9%, a difference of 0.0%), Ugandan (97.9%, a difference of 0.010%), Spanish American (97.9%, a difference of 0.010%), and Immigrants from Jordan (97.9%, a difference of 0.010%).
| Demographics | Rating | Rank | 2nd Grade |
| Immigrants | South Central Asia | 68.3 /100 | #153 | Good 97.9% |
| Marshallese | 67.7 /100 | #154 | Good 97.9% |
| French American Indians | 64.3 /100 | #155 | Good 97.9% |
| Dutch West Indians | 63.8 /100 | #156 | Good 97.9% |
| Venezuelans | 63.3 /100 | #157 | Good 97.9% |
| Immigrants | Iran | 62.8 /100 | #158 | Good 97.9% |
| Comanche | 62.8 /100 | #159 | Good 97.9% |
| Immigrants | Eastern Europe | 61.1 /100 | #160 | Good 97.9% |
| Immigrants | Russia | 60.3 /100 | #161 | Good 97.9% |
| Immigrants | Italy | 60.2 /100 | #162 | Good 97.9% |
| Bermudans | 59.4 /100 | #163 | Average 97.9% |
| Ugandans | 56.6 /100 | #164 | Average 97.9% |
| Spanish Americans | 56.4 /100 | #165 | Average 97.9% |
| Immigrants | Jordan | 56.3 /100 | #166 | Average 97.9% |
| Chileans | 56.1 /100 | #167 | Average 97.9% |
| Brazilians | 55.8 /100 | #168 | Average 97.9% |
| Immigrants | Spain | 55.4 /100 | #169 | Average 97.9% |
| Navajo | 54.3 /100 | #170 | Average 97.9% |
| Albanians | 52.8 /100 | #171 | Average 97.9% |
| Immigrants | Korea | 52.7 /100 | #172 | Average 97.9% |
| Kenyans | 52.7 /100 | #173 | Average 97.9% |