Marshallese vs Chickasaw 8th Grade
COMPARE
Marshallese
Chickasaw
8th Grade
8th Grade Comparison
Marshallese
Chickasaw
95.7%
8TH GRADE
47.6/ 100
METRIC RATING
177th/ 347
METRIC RANK
96.4%
8TH GRADE
98.9/ 100
METRIC RATING
89th/ 347
METRIC RANK
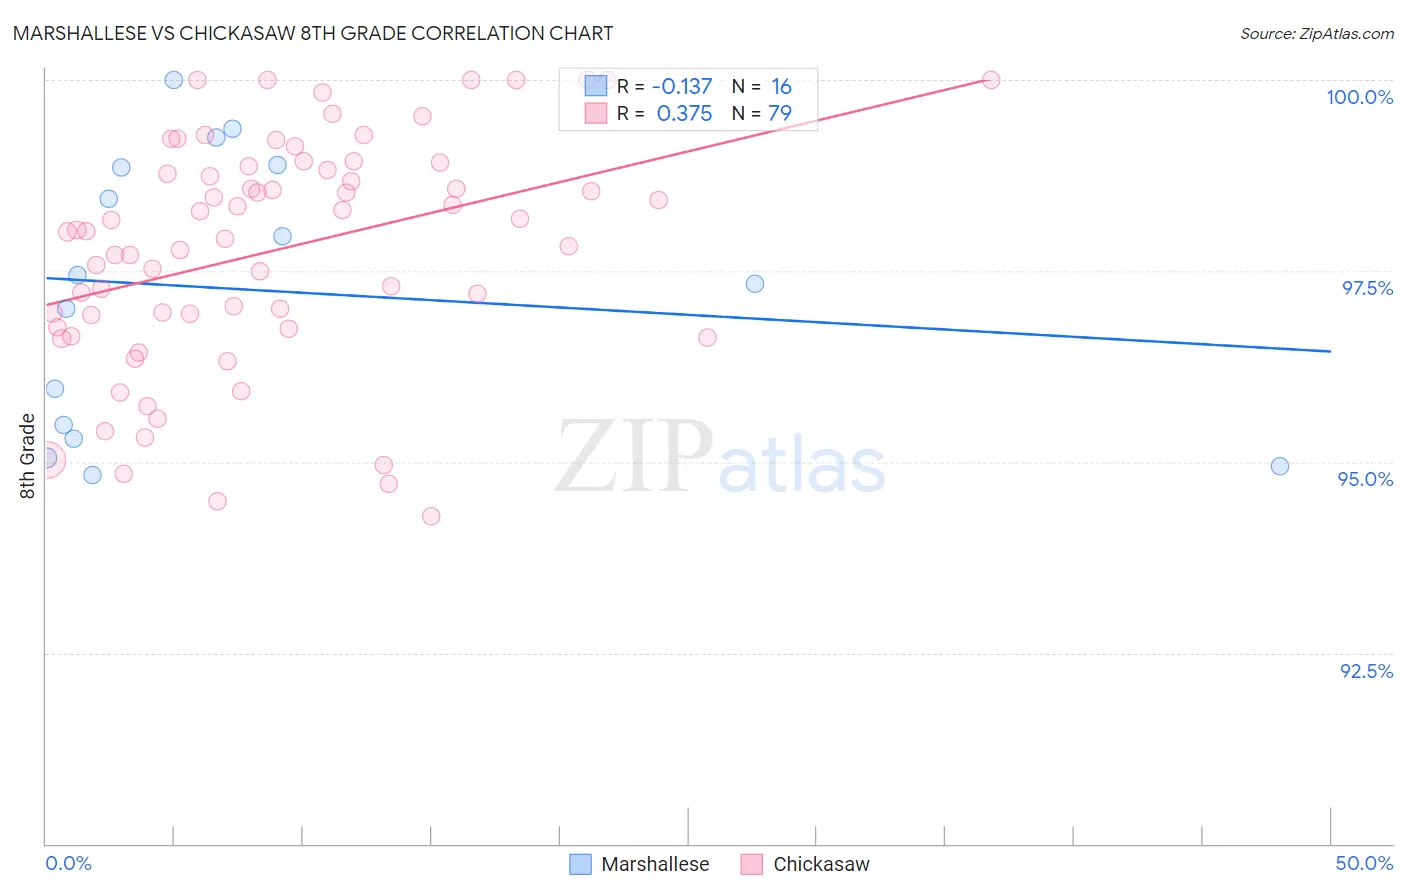
Marshallese vs Chickasaw 8th Grade Correlation Chart
The statistical analysis conducted on geographies consisting of 14,761,315 people shows a poor negative correlation between the proportion of Marshallese and percentage of population with at least 8th grade education in the United States with a correlation coefficient (R) of -0.137 and weighted average of 95.7%. Similarly, the statistical analysis conducted on geographies consisting of 147,726,545 people shows a mild positive correlation between the proportion of Chickasaw and percentage of population with at least 8th grade education in the United States with a correlation coefficient (R) of 0.375 and weighted average of 96.4%, a difference of 0.74%.
8th Grade Correlation Summary
| Measurement | Marshallese | Chickasaw |
| Minimum | 94.8% | 94.3% |
| Maximum | 100.0% | 100.0% |
| Range | 5.2% | 5.7% |
| Mean | 97.3% | 97.8% |
| Median | 97.4% | 98.0% |
| Interquartile 25% (IQ1) | 95.4% | 96.8% |
| Interquartile 75% (IQ3) | 98.9% | 98.9% |
| Interquartile Range (IQR) | 3.5% | 2.1% |
| Standard Deviation (Sample) | 1.8% | 1.5% |
| Standard Deviation (Population) | 1.7% | 1.5% |
Similar Demographics by 8th Grade
Demographics Similar to Marshallese by 8th Grade
In terms of 8th grade, the demographic groups most similar to Marshallese are Venezuelan (95.7%, a difference of 0.0%), Immigrants from Albania (95.7%, a difference of 0.010%), Pakistani (95.7%, a difference of 0.010%), Immigrants from Brazil (95.7%, a difference of 0.010%), and Chilean (95.7%, a difference of 0.020%).
| Demographics | Rating | Rank | 8th Grade |
| Ute | 58.5 /100 | #170 | Average 95.8% |
| Egyptians | 58.2 /100 | #171 | Average 95.8% |
| Immigrants | Korea | 57.9 /100 | #172 | Average 95.8% |
| Mongolians | 53.0 /100 | #173 | Average 95.8% |
| Chileans | 50.0 /100 | #174 | Average 95.7% |
| Immigrants | Albania | 49.6 /100 | #175 | Average 95.7% |
| Pakistanis | 48.8 /100 | #176 | Average 95.7% |
| Marshallese | 47.6 /100 | #177 | Average 95.7% |
| Venezuelans | 47.5 /100 | #178 | Average 95.7% |
| Immigrants | Brazil | 45.4 /100 | #179 | Average 95.7% |
| Iraqis | 40.5 /100 | #180 | Average 95.7% |
| Immigrants | Spain | 38.7 /100 | #181 | Fair 95.7% |
| Immigrants | Egypt | 37.9 /100 | #182 | Fair 95.7% |
| Immigrants | Iraq | 36.2 /100 | #183 | Fair 95.6% |
| Immigrants | Uganda | 36.0 /100 | #184 | Fair 95.6% |
Demographics Similar to Chickasaw by 8th Grade
In terms of 8th grade, the demographic groups most similar to Chickasaw are Immigrants from Sweden (96.4%, a difference of 0.0%), Immigrants from Western Europe (96.4%, a difference of 0.010%), Thai (96.4%, a difference of 0.010%), Menominee (96.4%, a difference of 0.010%), and Immigrants from Denmark (96.4%, a difference of 0.010%).
| Demographics | Rating | Rank | 8th Grade |
| Turks | 99.2 /100 | #82 | Exceptional 96.5% |
| Icelanders | 99.2 /100 | #83 | Exceptional 96.5% |
| Immigrants | Belgium | 99.1 /100 | #84 | Exceptional 96.5% |
| Immigrants | South Africa | 99.1 /100 | #85 | Exceptional 96.5% |
| Cherokee | 99.0 /100 | #86 | Exceptional 96.5% |
| Immigrants | Australia | 99.0 /100 | #87 | Exceptional 96.5% |
| Immigrants | Western Europe | 99.0 /100 | #88 | Exceptional 96.4% |
| Chickasaw | 98.9 /100 | #89 | Exceptional 96.4% |
| Immigrants | Sweden | 98.9 /100 | #90 | Exceptional 96.4% |
| Thais | 98.9 /100 | #91 | Exceptional 96.4% |
| Menominee | 98.9 /100 | #92 | Exceptional 96.4% |
| Immigrants | Denmark | 98.8 /100 | #93 | Exceptional 96.4% |
| Immigrants | Singapore | 98.8 /100 | #94 | Exceptional 96.4% |
| German Russians | 98.8 /100 | #95 | Exceptional 96.4% |
| Potawatomi | 98.7 /100 | #96 | Exceptional 96.4% |