Marshallese vs Houma 11th Grade
COMPARE
Marshallese
Houma
11th Grade
11th Grade Comparison
Marshallese
Houma
92.3%
11TH GRADE
26.0/ 100
METRIC RATING
197th/ 347
METRIC RANK
87.0%
11TH GRADE
0.0/ 100
METRIC RATING
334th/ 347
METRIC RANK
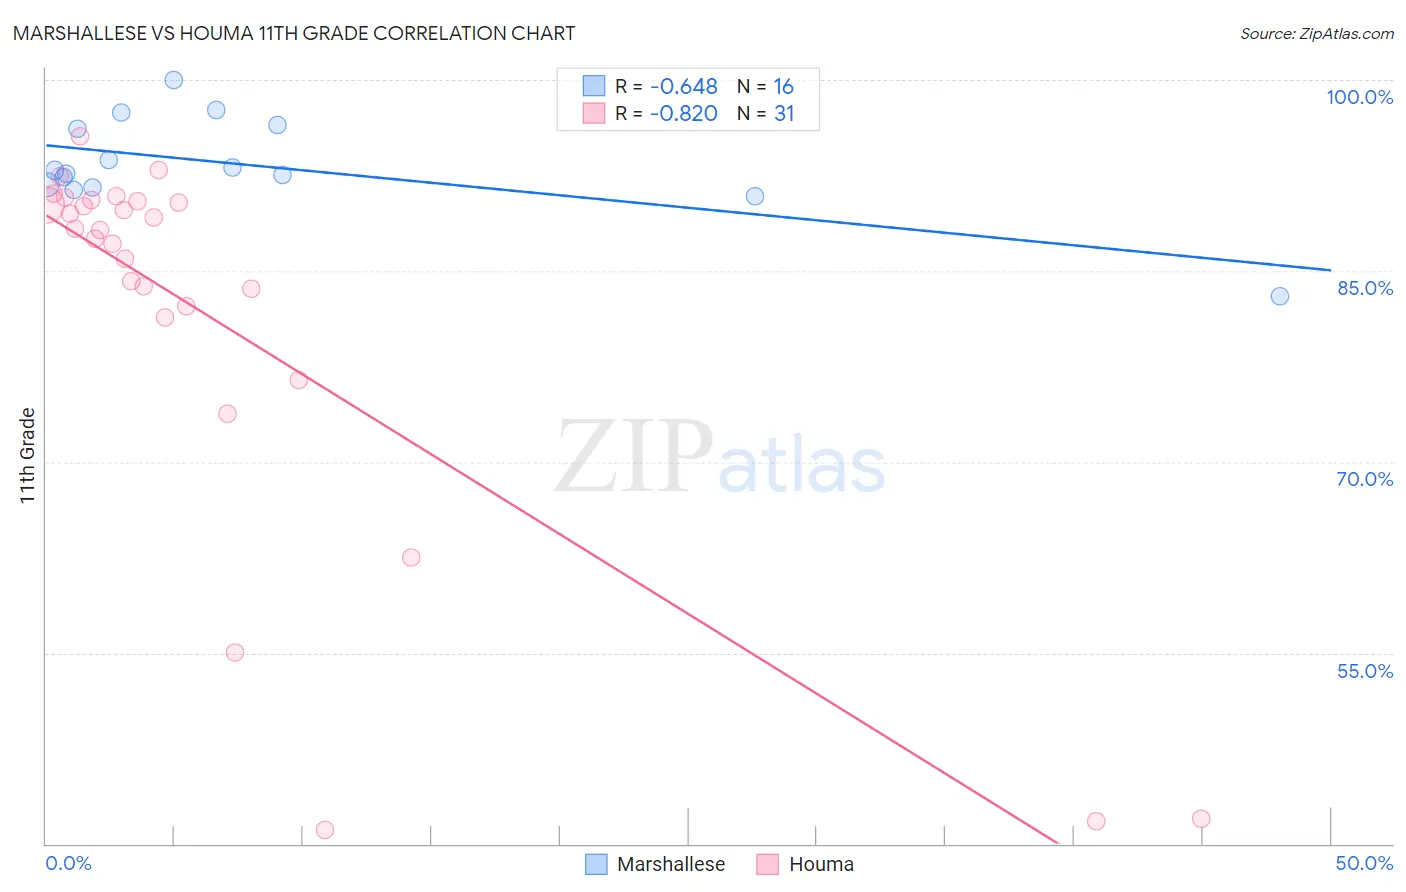
Marshallese vs Houma 11th Grade Correlation Chart
The statistical analysis conducted on geographies consisting of 14,761,315 people shows a significant negative correlation between the proportion of Marshallese and percentage of population with at least 11th grade education in the United States with a correlation coefficient (R) of -0.648 and weighted average of 92.3%. Similarly, the statistical analysis conducted on geographies consisting of 36,795,916 people shows a very strong negative correlation between the proportion of Houma and percentage of population with at least 11th grade education in the United States with a correlation coefficient (R) of -0.820 and weighted average of 87.0%, a difference of 6.0%.
11th Grade Correlation Summary
| Measurement | Marshallese | Houma |
| Minimum | 83.0% | 41.1% |
| Maximum | 100.0% | 95.5% |
| Range | 17.0% | 54.5% |
| Mean | 93.3% | 81.2% |
| Median | 92.8% | 88.2% |
| Interquartile 25% (IQ1) | 91.7% | 81.4% |
| Interquartile 75% (IQ3) | 96.3% | 90.4% |
| Interquartile Range (IQR) | 4.6% | 9.1% |
| Standard Deviation (Sample) | 3.8% | 15.7% |
| Standard Deviation (Population) | 3.7% | 15.5% |
Similar Demographics by 11th Grade
Demographics Similar to Marshallese by 11th Grade
In terms of 11th grade, the demographic groups most similar to Marshallese are Liberian (92.3%, a difference of 0.010%), Panamanian (92.3%, a difference of 0.010%), Hawaiian (92.3%, a difference of 0.010%), Immigrants from Uganda (92.3%, a difference of 0.010%), and Samoan (92.3%, a difference of 0.010%).
| Demographics | Rating | Rank | 11th Grade |
| Chickasaw | 31.4 /100 | #190 | Fair 92.3% |
| French American Indians | 30.8 /100 | #191 | Fair 92.3% |
| Immigrants | Syria | 30.4 /100 | #192 | Fair 92.3% |
| Moroccans | 28.7 /100 | #193 | Fair 92.3% |
| Sioux | 28.5 /100 | #194 | Fair 92.3% |
| Liberians | 26.8 /100 | #195 | Fair 92.3% |
| Panamanians | 26.4 /100 | #196 | Fair 92.3% |
| Marshallese | 26.0 /100 | #197 | Fair 92.3% |
| Hawaiians | 25.5 /100 | #198 | Fair 92.3% |
| Immigrants | Uganda | 25.2 /100 | #199 | Fair 92.3% |
| Samoans | 25.1 /100 | #200 | Fair 92.3% |
| Immigrants | China | 25.1 /100 | #201 | Fair 92.3% |
| Immigrants | Eastern Africa | 24.1 /100 | #202 | Fair 92.3% |
| Immigrants | Sudan | 23.5 /100 | #203 | Fair 92.3% |
| Immigrants | Hong Kong | 23.3 /100 | #204 | Fair 92.2% |
Demographics Similar to Houma by 11th Grade
In terms of 11th grade, the demographic groups most similar to Houma are Immigrants from Yemen (87.1%, a difference of 0.060%), Central American (86.9%, a difference of 0.10%), Immigrants from Dominican Republic (86.9%, a difference of 0.14%), Immigrants from Honduras (86.9%, a difference of 0.14%), and Immigrants from the Azores (87.2%, a difference of 0.24%).
| Demographics | Rating | Rank | 11th Grade |
| Immigrants | Cabo Verde | 0.0 /100 | #327 | Tragic 87.6% |
| Tohono O'odham | 0.0 /100 | #328 | Tragic 87.6% |
| Mexican American Indians | 0.0 /100 | #329 | Tragic 87.5% |
| Hondurans | 0.0 /100 | #330 | Tragic 87.4% |
| Hispanics or Latinos | 0.0 /100 | #331 | Tragic 87.3% |
| Immigrants | Azores | 0.0 /100 | #332 | Tragic 87.2% |
| Immigrants | Yemen | 0.0 /100 | #333 | Tragic 87.1% |
| Houma | 0.0 /100 | #334 | Tragic 87.0% |
| Central Americans | 0.0 /100 | #335 | Tragic 86.9% |
| Immigrants | Dominican Republic | 0.0 /100 | #336 | Tragic 86.9% |
| Immigrants | Honduras | 0.0 /100 | #337 | Tragic 86.9% |
| Immigrants | Latin America | 0.0 /100 | #338 | Tragic 86.8% |
| Guatemalans | 0.0 /100 | #339 | Tragic 86.4% |
| Salvadorans | 0.0 /100 | #340 | Tragic 86.2% |
| Mexicans | 0.0 /100 | #341 | Tragic 86.1% |