Polish vs Immigrants from Eritrea 11th Grade
COMPARE
Polish
Immigrants from Eritrea
11th Grade
11th Grade Comparison
Poles
Immigrants from Eritrea
94.8%
11TH GRADE
100.0/ 100
METRIC RATING
7th/ 347
METRIC RANK
91.4%
11TH GRADE
0.7/ 100
METRIC RATING
254th/ 347
METRIC RANK
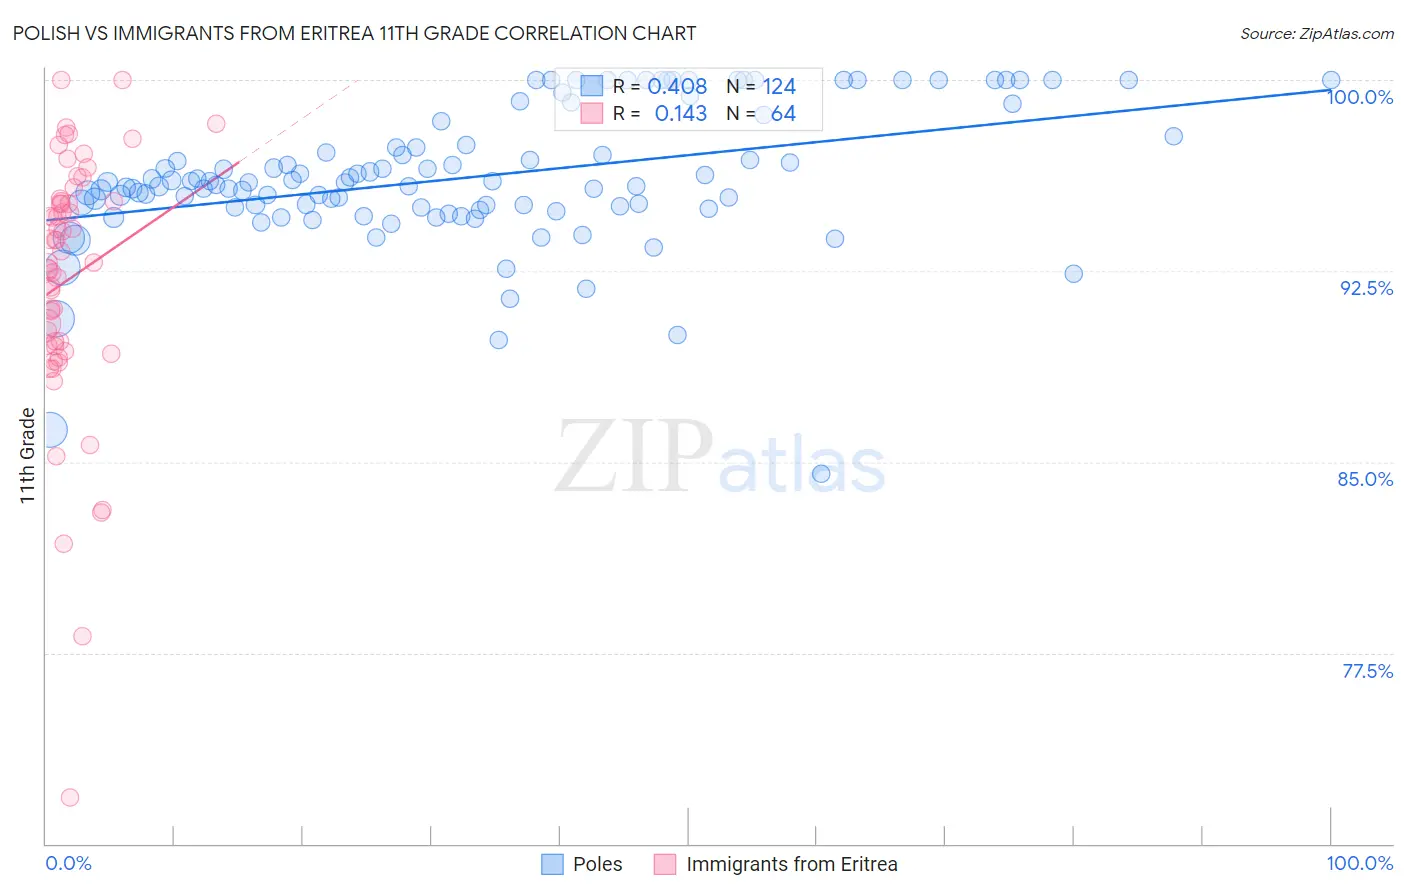
Polish vs Immigrants from Eritrea 11th Grade Correlation Chart
The statistical analysis conducted on geographies consisting of 560,594,575 people shows a moderate positive correlation between the proportion of Poles and percentage of population with at least 11th grade education in the United States with a correlation coefficient (R) of 0.408 and weighted average of 94.8%. Similarly, the statistical analysis conducted on geographies consisting of 104,754,230 people shows a poor positive correlation between the proportion of Immigrants from Eritrea and percentage of population with at least 11th grade education in the United States with a correlation coefficient (R) of 0.143 and weighted average of 91.4%, a difference of 3.7%.
11th Grade Correlation Summary
| Measurement | Polish | Immigrants from Eritrea |
| Minimum | 84.5% | 71.8% |
| Maximum | 100.0% | 100.0% |
| Range | 15.5% | 28.2% |
| Mean | 96.2% | 92.2% |
| Median | 96.0% | 93.1% |
| Interquartile 25% (IQ1) | 95.0% | 89.6% |
| Interquartile 75% (IQ3) | 97.6% | 95.2% |
| Interquartile Range (IQR) | 2.6% | 5.7% |
| Standard Deviation (Sample) | 2.7% | 5.1% |
| Standard Deviation (Population) | 2.7% | 5.1% |
Similar Demographics by 11th Grade
Demographics Similar to Poles by 11th Grade
In terms of 11th grade, the demographic groups most similar to Poles are Croatian (94.7%, a difference of 0.010%), Lithuanian (94.8%, a difference of 0.050%), Danish (94.7%, a difference of 0.050%), Finnish (94.7%, a difference of 0.090%), and Carpatho Rusyn (94.8%, a difference of 0.10%).
| Demographics | Rating | Rank | 11th Grade |
| Norwegians | 100.0 /100 | #1 | Exceptional 95.2% |
| Swedes | 100.0 /100 | #2 | Exceptional 94.9% |
| Slovenes | 100.0 /100 | #3 | Exceptional 94.9% |
| Slovaks | 100.0 /100 | #4 | Exceptional 94.9% |
| Carpatho Rusyns | 100.0 /100 | #5 | Exceptional 94.8% |
| Lithuanians | 100.0 /100 | #6 | Exceptional 94.8% |
| Poles | 100.0 /100 | #7 | Exceptional 94.8% |
| Croatians | 100.0 /100 | #8 | Exceptional 94.7% |
| Danes | 100.0 /100 | #9 | Exceptional 94.7% |
| Finns | 100.0 /100 | #10 | Exceptional 94.7% |
| Germans | 100.0 /100 | #11 | Exceptional 94.7% |
| Latvians | 100.0 /100 | #12 | Exceptional 94.7% |
| Chinese | 100.0 /100 | #13 | Exceptional 94.6% |
| Eastern Europeans | 100.0 /100 | #14 | Exceptional 94.6% |
| Bulgarians | 100.0 /100 | #15 | Exceptional 94.5% |
Demographics Similar to Immigrants from Eritrea by 11th Grade
In terms of 11th grade, the demographic groups most similar to Immigrants from Eritrea are Black/African American (91.4%, a difference of 0.010%), Immigrants from Senegal (91.4%, a difference of 0.010%), Immigrants from Nigeria (91.4%, a difference of 0.020%), Immigrants from South America (91.4%, a difference of 0.020%), and Cajun (91.4%, a difference of 0.020%).
| Demographics | Rating | Rank | 11th Grade |
| Immigrants | Philippines | 1.0 /100 | #247 | Tragic 91.5% |
| Immigrants | Uzbekistan | 1.0 /100 | #248 | Tragic 91.5% |
| Peruvians | 1.0 /100 | #249 | Tragic 91.5% |
| Ghanaians | 0.9 /100 | #250 | Tragic 91.5% |
| Immigrants | Costa Rica | 0.9 /100 | #251 | Tragic 91.4% |
| Immigrants | Nigeria | 0.8 /100 | #252 | Tragic 91.4% |
| Immigrants | South America | 0.8 /100 | #253 | Tragic 91.4% |
| Immigrants | Eritrea | 0.7 /100 | #254 | Tragic 91.4% |
| Blacks/African Americans | 0.7 /100 | #255 | Tragic 91.4% |
| Immigrants | Senegal | 0.7 /100 | #256 | Tragic 91.4% |
| Cajuns | 0.7 /100 | #257 | Tragic 91.4% |
| Immigrants | Colombia | 0.6 /100 | #258 | Tragic 91.4% |
| Jamaicans | 0.6 /100 | #259 | Tragic 91.4% |
| Spanish Americans | 0.6 /100 | #260 | Tragic 91.4% |
| Taiwanese | 0.6 /100 | #261 | Tragic 91.3% |