Marshallese vs Afghan 5th Grade
COMPARE
Marshallese
Afghan
5th Grade
5th Grade Comparison
Marshallese
Afghans
97.4%
5TH GRADE
61.2/ 100
METRIC RATING
160th/ 347
METRIC RANK
96.7%
5TH GRADE
0.2/ 100
METRIC RATING
270th/ 347
METRIC RANK
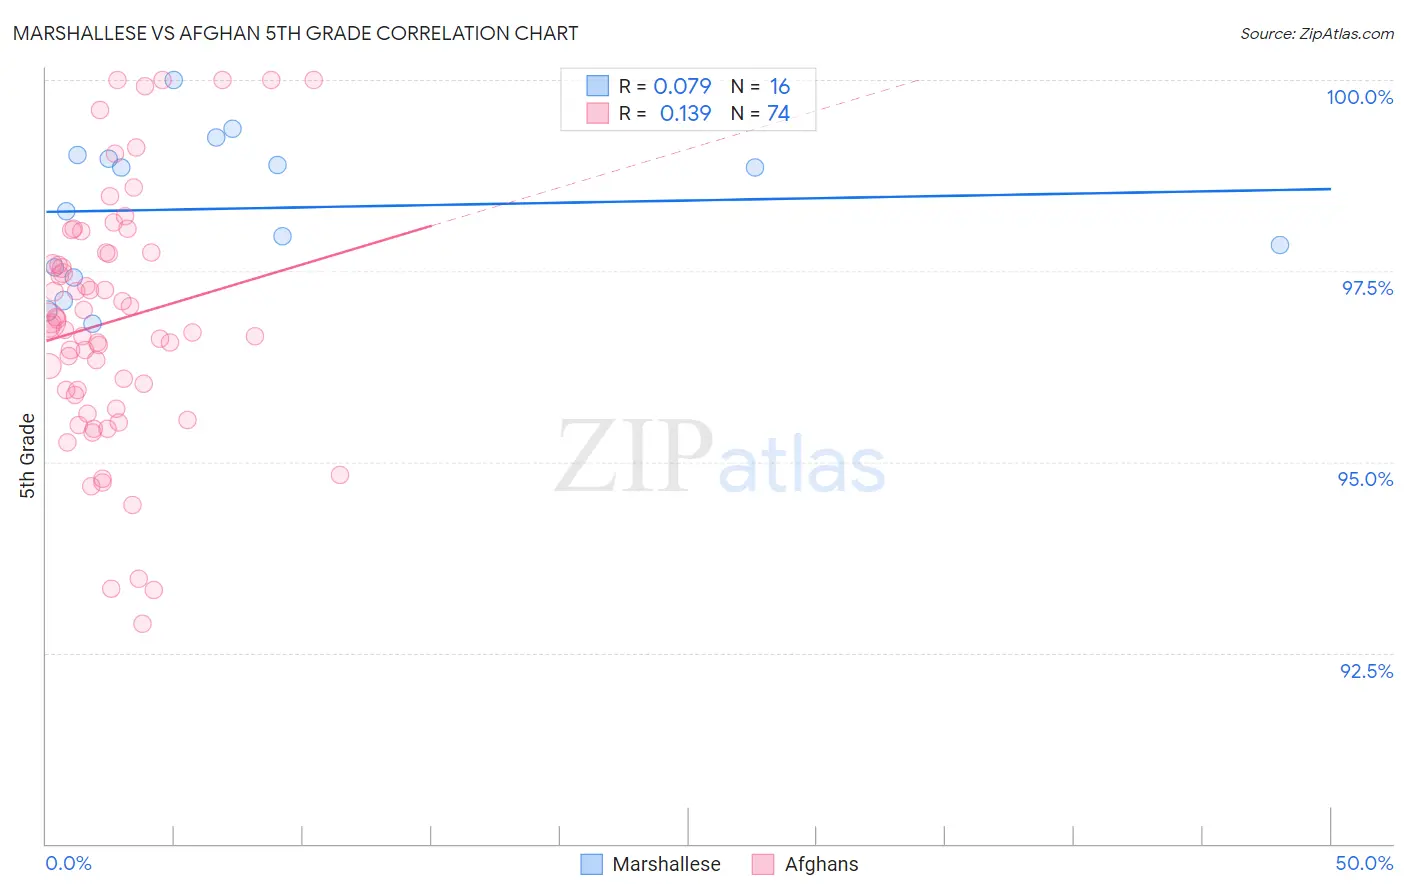
Marshallese vs Afghan 5th Grade Correlation Chart
The statistical analysis conducted on geographies consisting of 14,761,315 people shows a slight positive correlation between the proportion of Marshallese and percentage of population with at least 5th grade education in the United States with a correlation coefficient (R) of 0.079 and weighted average of 97.4%. Similarly, the statistical analysis conducted on geographies consisting of 148,851,685 people shows a poor positive correlation between the proportion of Afghans and percentage of population with at least 5th grade education in the United States with a correlation coefficient (R) of 0.139 and weighted average of 96.7%, a difference of 0.72%.
5th Grade Correlation Summary
| Measurement | Marshallese | Afghan |
| Minimum | 96.8% | 92.9% |
| Maximum | 100.0% | 100.0% |
| Range | 3.2% | 7.1% |
| Mean | 98.3% | 96.8% |
| Median | 98.6% | 96.8% |
| Interquartile 25% (IQ1) | 97.5% | 95.9% |
| Interquartile 75% (IQ3) | 99.0% | 97.7% |
| Interquartile Range (IQR) | 1.5% | 1.9% |
| Standard Deviation (Sample) | 0.96% | 1.6% |
| Standard Deviation (Population) | 0.93% | 1.6% |
Similar Demographics by 5th Grade
Demographics Similar to Marshallese by 5th Grade
In terms of 5th grade, the demographic groups most similar to Marshallese are Kenyan (97.4%, a difference of 0.010%), Immigrants from Iran (97.4%, a difference of 0.010%), Ugandan (97.4%, a difference of 0.010%), Bermudan (97.4%, a difference of 0.010%), and Immigrants from Poland (97.4%, a difference of 0.010%).
| Demographics | Rating | Rank | 5th Grade |
| Alsatians | 74.3 /100 | #153 | Good 97.4% |
| Immigrants | Russia | 71.2 /100 | #154 | Good 97.4% |
| Immigrants | Bosnia and Herzegovina | 71.0 /100 | #155 | Good 97.4% |
| French American Indians | 70.5 /100 | #156 | Good 97.4% |
| Immigrants | Jordan | 70.4 /100 | #157 | Good 97.4% |
| Albanians | 68.3 /100 | #158 | Good 97.4% |
| Immigrants | Italy | 65.2 /100 | #159 | Good 97.4% |
| Marshallese | 61.2 /100 | #160 | Good 97.4% |
| Kenyans | 59.7 /100 | #161 | Average 97.4% |
| Immigrants | Iran | 59.5 /100 | #162 | Average 97.4% |
| Ugandans | 58.9 /100 | #163 | Average 97.4% |
| Bermudans | 58.8 /100 | #164 | Average 97.4% |
| Immigrants | Poland | 57.9 /100 | #165 | Average 97.4% |
| Apache | 57.2 /100 | #166 | Average 97.4% |
| Immigrants | Belarus | 54.6 /100 | #167 | Average 97.3% |
Demographics Similar to Afghans by 5th Grade
In terms of 5th grade, the demographic groups most similar to Afghans are Immigrants from Hong Kong (96.7%, a difference of 0.0%), Trinidadian and Tobagonian (96.7%, a difference of 0.020%), Yaqui (96.7%, a difference of 0.020%), Immigrants from Cameroon (96.7%, a difference of 0.020%), and Immigrants from Peru (96.6%, a difference of 0.030%).
| Demographics | Rating | Rank | 5th Grade |
| Immigrants | Uzbekistan | 0.3 /100 | #263 | Tragic 96.8% |
| West Indians | 0.3 /100 | #264 | Tragic 96.8% |
| Taiwanese | 0.3 /100 | #265 | Tragic 96.7% |
| Immigrants | Nigeria | 0.3 /100 | #266 | Tragic 96.7% |
| Immigrants | South America | 0.3 /100 | #267 | Tragic 96.7% |
| Armenians | 0.3 /100 | #268 | Tragic 96.7% |
| Ghanaians | 0.2 /100 | #269 | Tragic 96.7% |
| Afghans | 0.2 /100 | #270 | Tragic 96.7% |
| Immigrants | Hong Kong | 0.2 /100 | #271 | Tragic 96.7% |
| Trinidadians and Tobagonians | 0.1 /100 | #272 | Tragic 96.7% |
| Yaqui | 0.1 /100 | #273 | Tragic 96.7% |
| Immigrants | Cameroon | 0.1 /100 | #274 | Tragic 96.7% |
| Immigrants | Peru | 0.1 /100 | #275 | Tragic 96.6% |
| Cubans | 0.1 /100 | #276 | Tragic 96.6% |
| Immigrants | Bolivia | 0.1 /100 | #277 | Tragic 96.6% |