Marshallese vs Afghan Child Poverty Under the Age of 16
COMPARE
Marshallese
Afghan
Child Poverty Under the Age of 16
Child Poverty Under the Age of 16 Comparison
Marshallese
Afghans
18.1%
CHILD POVERTY UNDER THE AGE OF 16
1.8/ 100
METRIC RATING
229th/ 347
METRIC RANK
16.2%
CHILD POVERTY UNDER THE AGE OF 16
52.3/ 100
METRIC RATING
172nd/ 347
METRIC RANK
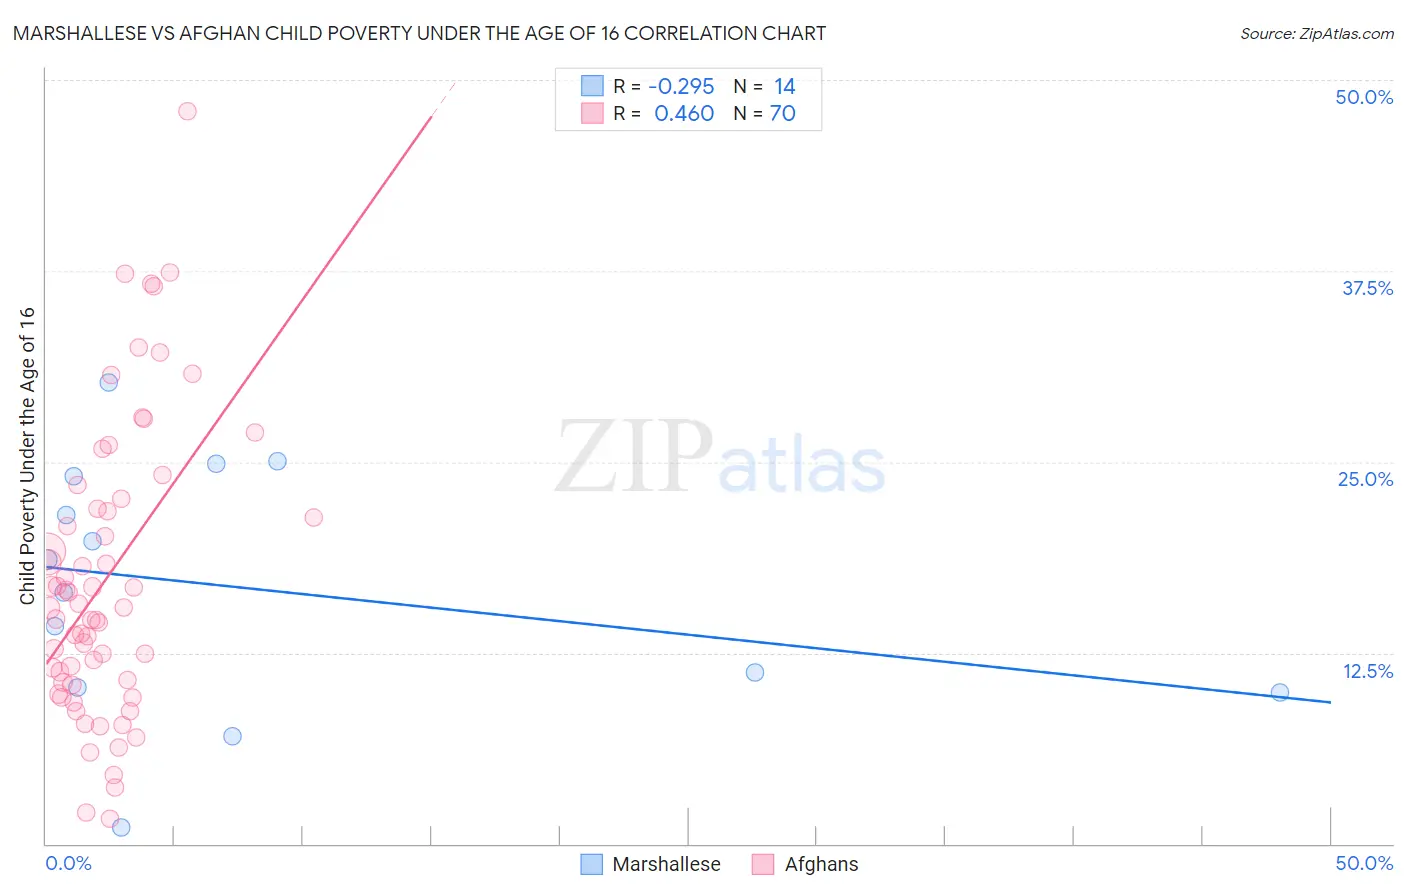
Marshallese vs Afghan Child Poverty Under the Age of 16 Correlation Chart
The statistical analysis conducted on geographies consisting of 14,745,855 people shows a weak negative correlation between the proportion of Marshallese and poverty level among children under the age of 16 in the United States with a correlation coefficient (R) of -0.295 and weighted average of 18.1%. Similarly, the statistical analysis conducted on geographies consisting of 148,458,786 people shows a moderate positive correlation between the proportion of Afghans and poverty level among children under the age of 16 in the United States with a correlation coefficient (R) of 0.460 and weighted average of 16.2%, a difference of 12.3%.
Child Poverty Under the Age of 16 Correlation Summary
| Measurement | Marshallese | Afghan |
| Minimum | 1.1% | 1.6% |
| Maximum | 30.2% | 48.0% |
| Range | 29.1% | 46.4% |
| Mean | 16.7% | 17.3% |
| Median | 17.5% | 15.5% |
| Interquartile 25% (IQ1) | 10.2% | 10.6% |
| Interquartile 75% (IQ3) | 24.1% | 21.9% |
| Interquartile Range (IQR) | 13.8% | 11.3% |
| Standard Deviation (Sample) | 8.2% | 9.5% |
| Standard Deviation (Population) | 7.9% | 9.4% |
Similar Demographics by Child Poverty Under the Age of 16
Demographics Similar to Marshallese by Child Poverty Under the Age of 16
In terms of child poverty under the age of 16, the demographic groups most similar to Marshallese are Nepalese (18.2%, a difference of 0.080%), Nicaraguan (18.2%, a difference of 0.14%), Immigrants from Micronesia (18.0%, a difference of 0.73%), Immigrants from Africa (18.0%, a difference of 0.88%), and American (18.3%, a difference of 1.0%).
| Demographics | Rating | Rank | Child Poverty Under the Age of 16 |
| Immigrants | Armenia | 3.6 /100 | #222 | Tragic 17.8% |
| Immigrants | Cambodia | 3.3 /100 | #223 | Tragic 17.8% |
| Osage | 3.1 /100 | #224 | Tragic 17.9% |
| Immigrants | Nonimmigrants | 2.7 /100 | #225 | Tragic 17.9% |
| Bermudans | 2.6 /100 | #226 | Tragic 18.0% |
| Immigrants | Africa | 2.5 /100 | #227 | Tragic 18.0% |
| Immigrants | Micronesia | 2.3 /100 | #228 | Tragic 18.0% |
| Marshallese | 1.8 /100 | #229 | Tragic 18.1% |
| Nepalese | 1.7 /100 | #230 | Tragic 18.2% |
| Nicaraguans | 1.7 /100 | #231 | Tragic 18.2% |
| Americans | 1.2 /100 | #232 | Tragic 18.3% |
| Fijians | 1.1 /100 | #233 | Tragic 18.4% |
| Immigrants | Nigeria | 1.0 /100 | #234 | Tragic 18.4% |
| Nigerians | 1.0 /100 | #235 | Tragic 18.4% |
| Cree | 0.9 /100 | #236 | Tragic 18.5% |
Demographics Similar to Afghans by Child Poverty Under the Age of 16
In terms of child poverty under the age of 16, the demographic groups most similar to Afghans are Hungarian (16.2%, a difference of 0.020%), Immigrants from Saudi Arabia (16.2%, a difference of 0.020%), Immigrants from Colombia (16.1%, a difference of 0.26%), White/Caucasian (16.2%, a difference of 0.27%), and Uruguayan (16.1%, a difference of 0.29%).
| Demographics | Rating | Rank | Child Poverty Under the Age of 16 |
| Guamanians/Chamorros | 66.4 /100 | #165 | Good 15.9% |
| Immigrants | Oceania | 65.4 /100 | #166 | Good 15.9% |
| Costa Ricans | 61.1 /100 | #167 | Good 16.0% |
| South Americans | 57.9 /100 | #168 | Average 16.0% |
| Uruguayans | 54.7 /100 | #169 | Average 16.1% |
| Immigrants | Colombia | 54.4 /100 | #170 | Average 16.1% |
| Hungarians | 52.5 /100 | #171 | Average 16.2% |
| Afghans | 52.3 /100 | #172 | Average 16.2% |
| Immigrants | Saudi Arabia | 52.1 /100 | #173 | Average 16.2% |
| Whites/Caucasians | 50.0 /100 | #174 | Average 16.2% |
| Scotch-Irish | 47.1 /100 | #175 | Average 16.3% |
| Lebanese | 45.9 /100 | #176 | Average 16.3% |
| Ethiopians | 43.4 /100 | #177 | Average 16.3% |
| Immigrants | Ethiopia | 42.3 /100 | #178 | Average 16.4% |
| Immigrants | Syria | 42.3 /100 | #179 | Average 16.4% |