Immigrants from Korea vs Afghan 5th Grade
COMPARE
Immigrants from Korea
Afghan
5th Grade
5th Grade Comparison
Immigrants from Korea
Afghans
97.3%
5TH GRADE
54.1/ 100
METRIC RATING
169th/ 347
METRIC RANK
96.7%
5TH GRADE
0.2/ 100
METRIC RATING
270th/ 347
METRIC RANK
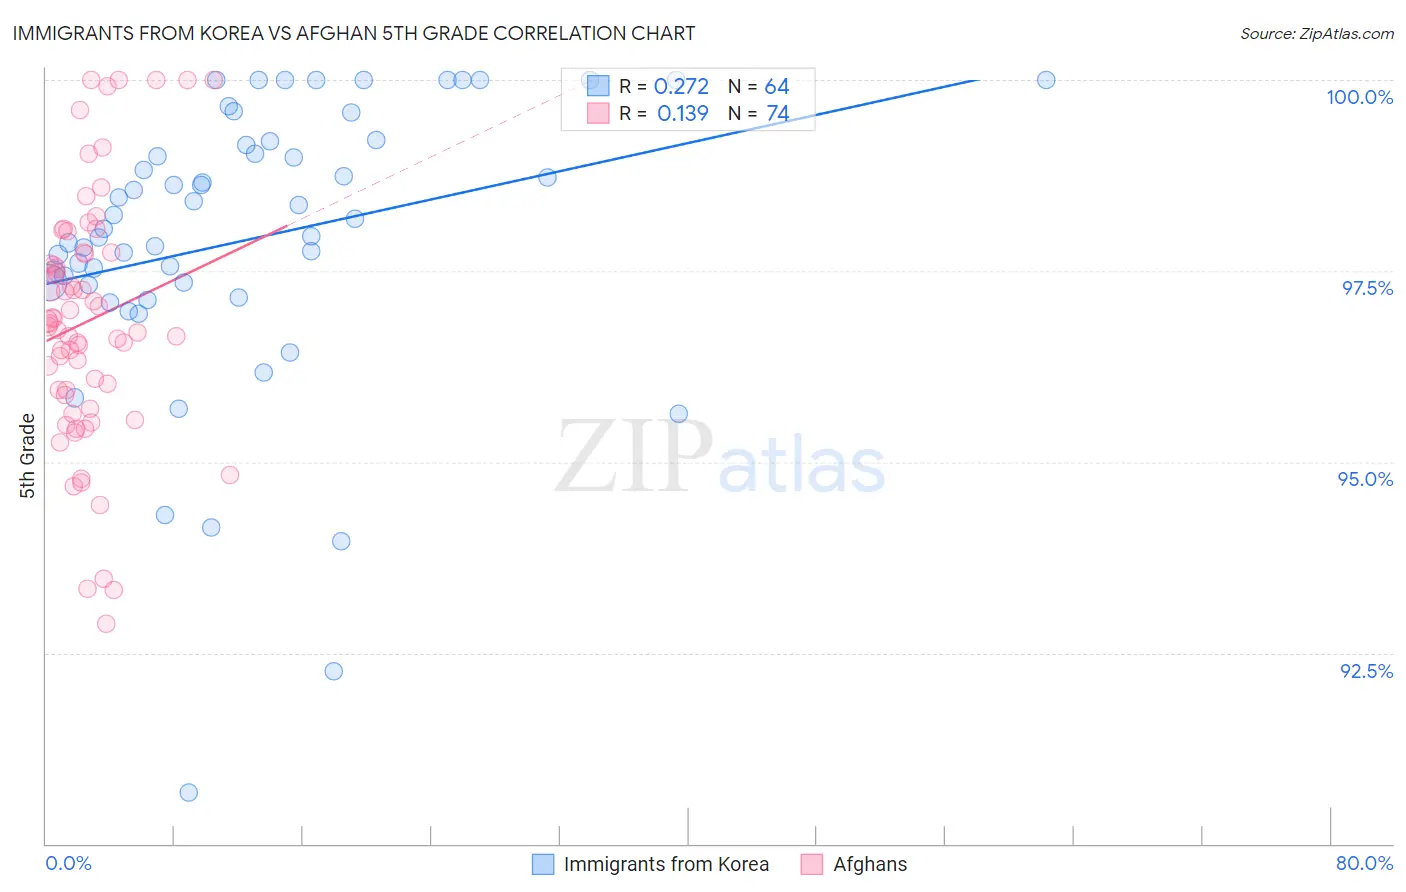
Immigrants from Korea vs Afghan 5th Grade Correlation Chart
The statistical analysis conducted on geographies consisting of 416,280,076 people shows a weak positive correlation between the proportion of Immigrants from Korea and percentage of population with at least 5th grade education in the United States with a correlation coefficient (R) of 0.272 and weighted average of 97.3%. Similarly, the statistical analysis conducted on geographies consisting of 148,851,685 people shows a poor positive correlation between the proportion of Afghans and percentage of population with at least 5th grade education in the United States with a correlation coefficient (R) of 0.139 and weighted average of 96.7%, a difference of 0.69%.
5th Grade Correlation Summary
| Measurement | Immigrants from Korea | Afghan |
| Minimum | 90.7% | 92.9% |
| Maximum | 100.0% | 100.0% |
| Range | 9.3% | 7.1% |
| Mean | 97.9% | 96.8% |
| Median | 98.1% | 96.8% |
| Interquartile 25% (IQ1) | 97.3% | 95.9% |
| Interquartile 75% (IQ3) | 99.2% | 97.7% |
| Interquartile Range (IQR) | 1.8% | 1.9% |
| Standard Deviation (Sample) | 1.9% | 1.6% |
| Standard Deviation (Population) | 1.9% | 1.6% |
Similar Demographics by 5th Grade
Demographics Similar to Immigrants from Korea by 5th Grade
In terms of 5th grade, the demographic groups most similar to Immigrants from Korea are Immigrants from Belarus (97.3%, a difference of 0.0%), Chilean (97.3%, a difference of 0.0%), Venezuelan (97.3%, a difference of 0.0%), Immigrants from Sri Lanka (97.3%, a difference of 0.0%), and Arab (97.3%, a difference of 0.0%).
| Demographics | Rating | Rank | 5th Grade |
| Immigrants | Iran | 59.5 /100 | #162 | Average 97.4% |
| Ugandans | 58.9 /100 | #163 | Average 97.4% |
| Bermudans | 58.8 /100 | #164 | Average 97.4% |
| Immigrants | Poland | 57.9 /100 | #165 | Average 97.4% |
| Apache | 57.2 /100 | #166 | Average 97.4% |
| Immigrants | Belarus | 54.6 /100 | #167 | Average 97.3% |
| Chileans | 54.5 /100 | #168 | Average 97.3% |
| Immigrants | Korea | 54.1 /100 | #169 | Average 97.3% |
| Venezuelans | 54.0 /100 | #170 | Average 97.3% |
| Immigrants | Sri Lanka | 53.8 /100 | #171 | Average 97.3% |
| Arabs | 53.4 /100 | #172 | Average 97.3% |
| Egyptians | 52.4 /100 | #173 | Average 97.3% |
| Immigrants | Kazakhstan | 50.0 /100 | #174 | Average 97.3% |
| Immigrants | Micronesia | 48.8 /100 | #175 | Average 97.3% |
| Immigrants | Taiwan | 48.4 /100 | #176 | Average 97.3% |
Demographics Similar to Afghans by 5th Grade
In terms of 5th grade, the demographic groups most similar to Afghans are Immigrants from Hong Kong (96.7%, a difference of 0.0%), Trinidadian and Tobagonian (96.7%, a difference of 0.020%), Yaqui (96.7%, a difference of 0.020%), Immigrants from Cameroon (96.7%, a difference of 0.020%), and Immigrants from Peru (96.6%, a difference of 0.030%).
| Demographics | Rating | Rank | 5th Grade |
| Immigrants | Uzbekistan | 0.3 /100 | #263 | Tragic 96.8% |
| West Indians | 0.3 /100 | #264 | Tragic 96.8% |
| Taiwanese | 0.3 /100 | #265 | Tragic 96.7% |
| Immigrants | Nigeria | 0.3 /100 | #266 | Tragic 96.7% |
| Immigrants | South America | 0.3 /100 | #267 | Tragic 96.7% |
| Armenians | 0.3 /100 | #268 | Tragic 96.7% |
| Ghanaians | 0.2 /100 | #269 | Tragic 96.7% |
| Afghans | 0.2 /100 | #270 | Tragic 96.7% |
| Immigrants | Hong Kong | 0.2 /100 | #271 | Tragic 96.7% |
| Trinidadians and Tobagonians | 0.1 /100 | #272 | Tragic 96.7% |
| Yaqui | 0.1 /100 | #273 | Tragic 96.7% |
| Immigrants | Cameroon | 0.1 /100 | #274 | Tragic 96.7% |
| Immigrants | Peru | 0.1 /100 | #275 | Tragic 96.6% |
| Cubans | 0.1 /100 | #276 | Tragic 96.6% |
| Immigrants | Bolivia | 0.1 /100 | #277 | Tragic 96.6% |