Marshallese vs Immigrants from Middle Africa 5th Grade
COMPARE
Marshallese
Immigrants from Middle Africa
5th Grade
5th Grade Comparison
Marshallese
Immigrants from Middle Africa
97.4%
5TH GRADE
61.2/ 100
METRIC RATING
160th/ 347
METRIC RANK
96.8%
5TH GRADE
0.8/ 100
METRIC RATING
253rd/ 347
METRIC RANK
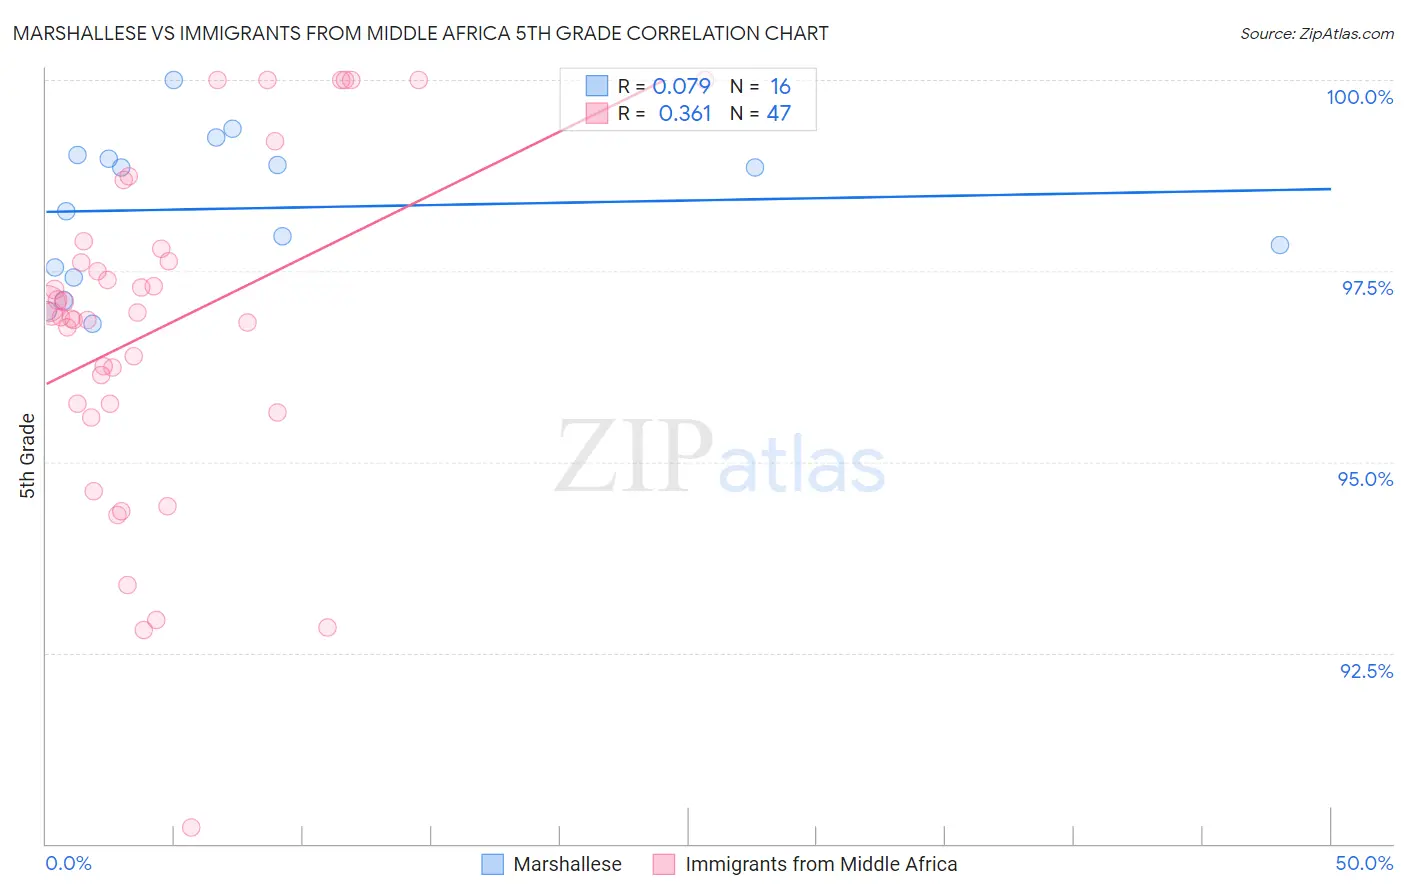
Marshallese vs Immigrants from Middle Africa 5th Grade Correlation Chart
The statistical analysis conducted on geographies consisting of 14,761,315 people shows a slight positive correlation between the proportion of Marshallese and percentage of population with at least 5th grade education in the United States with a correlation coefficient (R) of 0.079 and weighted average of 97.4%. Similarly, the statistical analysis conducted on geographies consisting of 202,721,852 people shows a mild positive correlation between the proportion of Immigrants from Middle Africa and percentage of population with at least 5th grade education in the United States with a correlation coefficient (R) of 0.361 and weighted average of 96.8%, a difference of 0.55%.
5th Grade Correlation Summary
| Measurement | Marshallese | Immigrants from Middle Africa |
| Minimum | 96.8% | 90.2% |
| Maximum | 100.0% | 100.0% |
| Range | 3.2% | 9.8% |
| Mean | 98.3% | 96.8% |
| Median | 98.6% | 96.9% |
| Interquartile 25% (IQ1) | 97.5% | 95.8% |
| Interquartile 75% (IQ3) | 99.0% | 97.8% |
| Interquartile Range (IQR) | 1.5% | 2.0% |
| Standard Deviation (Sample) | 0.96% | 2.2% |
| Standard Deviation (Population) | 0.93% | 2.2% |
Similar Demographics by 5th Grade
Demographics Similar to Marshallese by 5th Grade
In terms of 5th grade, the demographic groups most similar to Marshallese are Kenyan (97.4%, a difference of 0.010%), Immigrants from Iran (97.4%, a difference of 0.010%), Ugandan (97.4%, a difference of 0.010%), Bermudan (97.4%, a difference of 0.010%), and Immigrants from Poland (97.4%, a difference of 0.010%).
| Demographics | Rating | Rank | 5th Grade |
| Alsatians | 74.3 /100 | #153 | Good 97.4% |
| Immigrants | Russia | 71.2 /100 | #154 | Good 97.4% |
| Immigrants | Bosnia and Herzegovina | 71.0 /100 | #155 | Good 97.4% |
| French American Indians | 70.5 /100 | #156 | Good 97.4% |
| Immigrants | Jordan | 70.4 /100 | #157 | Good 97.4% |
| Albanians | 68.3 /100 | #158 | Good 97.4% |
| Immigrants | Italy | 65.2 /100 | #159 | Good 97.4% |
| Marshallese | 61.2 /100 | #160 | Good 97.4% |
| Kenyans | 59.7 /100 | #161 | Average 97.4% |
| Immigrants | Iran | 59.5 /100 | #162 | Average 97.4% |
| Ugandans | 58.9 /100 | #163 | Average 97.4% |
| Bermudans | 58.8 /100 | #164 | Average 97.4% |
| Immigrants | Poland | 57.9 /100 | #165 | Average 97.4% |
| Apache | 57.2 /100 | #166 | Average 97.4% |
| Immigrants | Belarus | 54.6 /100 | #167 | Average 97.3% |
Demographics Similar to Immigrants from Middle Africa by 5th Grade
In terms of 5th grade, the demographic groups most similar to Immigrants from Middle Africa are Bolivian (96.9%, a difference of 0.010%), Jamaican (96.9%, a difference of 0.010%), Immigrants from Senegal (96.8%, a difference of 0.010%), Immigrants from Uruguay (96.9%, a difference of 0.020%), and Immigrants from Liberia (96.9%, a difference of 0.020%).
| Demographics | Rating | Rank | 5th Grade |
| Ethiopians | 1.2 /100 | #246 | Tragic 96.9% |
| Immigrants | Africa | 1.1 /100 | #247 | Tragic 96.9% |
| U.S. Virgin Islanders | 1.1 /100 | #248 | Tragic 96.9% |
| Immigrants | Uruguay | 1.0 /100 | #249 | Tragic 96.9% |
| Immigrants | Liberia | 1.0 /100 | #250 | Tragic 96.9% |
| Bolivians | 0.9 /100 | #251 | Tragic 96.9% |
| Jamaicans | 0.9 /100 | #252 | Tragic 96.9% |
| Immigrants | Middle Africa | 0.8 /100 | #253 | Tragic 96.8% |
| Immigrants | Senegal | 0.8 /100 | #254 | Tragic 96.8% |
| South Americans | 0.7 /100 | #255 | Tragic 96.8% |
| Immigrants | Congo | 0.7 /100 | #256 | Tragic 96.8% |
| Peruvians | 0.6 /100 | #257 | Tragic 96.8% |
| Immigrants | Ethiopia | 0.5 /100 | #258 | Tragic 96.8% |
| Immigrants | China | 0.5 /100 | #259 | Tragic 96.8% |
| Immigrants | Jamaica | 0.4 /100 | #260 | Tragic 96.8% |