Immigrants from St. Vincent and the Grenadines vs Afghan 5th Grade
COMPARE
Immigrants from St. Vincent and the Grenadines
Afghan
5th Grade
5th Grade Comparison
Immigrants from St. Vincent and the Grenadines
Afghans
96.6%
5TH GRADE
0.1/ 100
METRIC RATING
285th/ 347
METRIC RANK
96.7%
5TH GRADE
0.2/ 100
METRIC RATING
270th/ 347
METRIC RANK
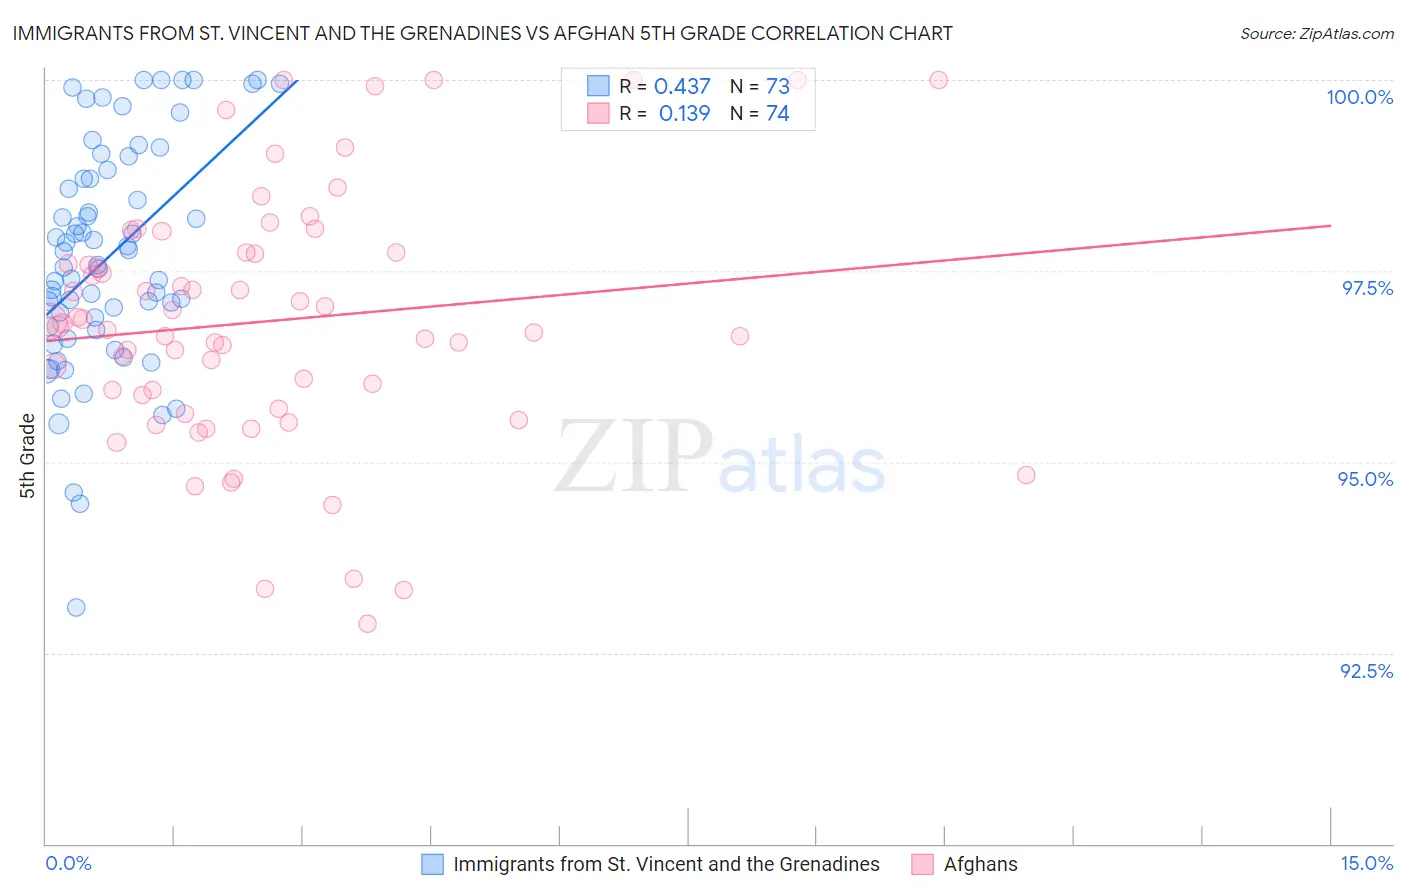
Immigrants from St. Vincent and the Grenadines vs Afghan 5th Grade Correlation Chart
The statistical analysis conducted on geographies consisting of 56,191,418 people shows a moderate positive correlation between the proportion of Immigrants from St. Vincent and the Grenadines and percentage of population with at least 5th grade education in the United States with a correlation coefficient (R) of 0.437 and weighted average of 96.6%. Similarly, the statistical analysis conducted on geographies consisting of 148,851,685 people shows a poor positive correlation between the proportion of Afghans and percentage of population with at least 5th grade education in the United States with a correlation coefficient (R) of 0.139 and weighted average of 96.7%, a difference of 0.090%.
5th Grade Correlation Summary
| Measurement | Immigrants from St. Vincent and the Grenadines | Afghan |
| Minimum | 93.1% | 92.9% |
| Maximum | 100.0% | 100.0% |
| Range | 6.9% | 7.1% |
| Mean | 97.7% | 96.8% |
| Median | 97.6% | 96.8% |
| Interquartile 25% (IQ1) | 96.7% | 95.9% |
| Interquartile 75% (IQ3) | 98.8% | 97.7% |
| Interquartile Range (IQR) | 2.0% | 1.9% |
| Standard Deviation (Sample) | 1.5% | 1.6% |
| Standard Deviation (Population) | 1.5% | 1.6% |
Demographics Similar to Immigrants from St. Vincent and the Grenadines and Afghans by 5th Grade
In terms of 5th grade, the demographic groups most similar to Immigrants from St. Vincent and the Grenadines are Immigrants from Thailand (96.6%, a difference of 0.0%), Immigrants from Trinidad and Tobago (96.6%, a difference of 0.010%), Immigrants from Western Africa (96.6%, a difference of 0.020%), Houma (96.6%, a difference of 0.020%), and Barbadian (96.6%, a difference of 0.020%). Similarly, the demographic groups most similar to Afghans are Immigrants from Hong Kong (96.7%, a difference of 0.0%), Trinidadian and Tobagonian (96.7%, a difference of 0.020%), Yaqui (96.7%, a difference of 0.020%), Immigrants from Cameroon (96.7%, a difference of 0.020%), and Immigrants from Peru (96.6%, a difference of 0.030%).
| Demographics | Rating | Rank | 5th Grade |
| Immigrants | South America | 0.3 /100 | #267 | Tragic 96.7% |
| Armenians | 0.3 /100 | #268 | Tragic 96.7% |
| Ghanaians | 0.2 /100 | #269 | Tragic 96.7% |
| Afghans | 0.2 /100 | #270 | Tragic 96.7% |
| Immigrants | Hong Kong | 0.2 /100 | #271 | Tragic 96.7% |
| Trinidadians and Tobagonians | 0.1 /100 | #272 | Tragic 96.7% |
| Yaqui | 0.1 /100 | #273 | Tragic 96.7% |
| Immigrants | Cameroon | 0.1 /100 | #274 | Tragic 96.7% |
| Immigrants | Peru | 0.1 /100 | #275 | Tragic 96.6% |
| Cubans | 0.1 /100 | #276 | Tragic 96.6% |
| Immigrants | Bolivia | 0.1 /100 | #277 | Tragic 96.6% |
| Immigrants | Ghana | 0.1 /100 | #278 | Tragic 96.6% |
| Immigrants | Philippines | 0.1 /100 | #279 | Tragic 96.6% |
| Immigrants | Western Africa | 0.1 /100 | #280 | Tragic 96.6% |
| Houma | 0.1 /100 | #281 | Tragic 96.6% |
| Barbadians | 0.1 /100 | #282 | Tragic 96.6% |
| Fijians | 0.1 /100 | #283 | Tragic 96.6% |
| Immigrants | Trinidad and Tobago | 0.1 /100 | #284 | Tragic 96.6% |
| Immigrants | St. Vincent and the Grenadines | 0.1 /100 | #285 | Tragic 96.6% |
| Immigrants | Thailand | 0.1 /100 | #286 | Tragic 96.6% |
| Immigrants | Afghanistan | 0.1 /100 | #287 | Tragic 96.6% |