Austrian vs Scottish Doctorate Degree
COMPARE
Austrian
Scottish
Doctorate Degree
Doctorate Degree Comparison
Austrians
Scottish
2.1%
DOCTORATE DEGREE
98.0/ 100
METRIC RATING
104th/ 347
METRIC RANK
2.0%
DOCTORATE DEGREE
89.4/ 100
METRIC RATING
132nd/ 347
METRIC RANK
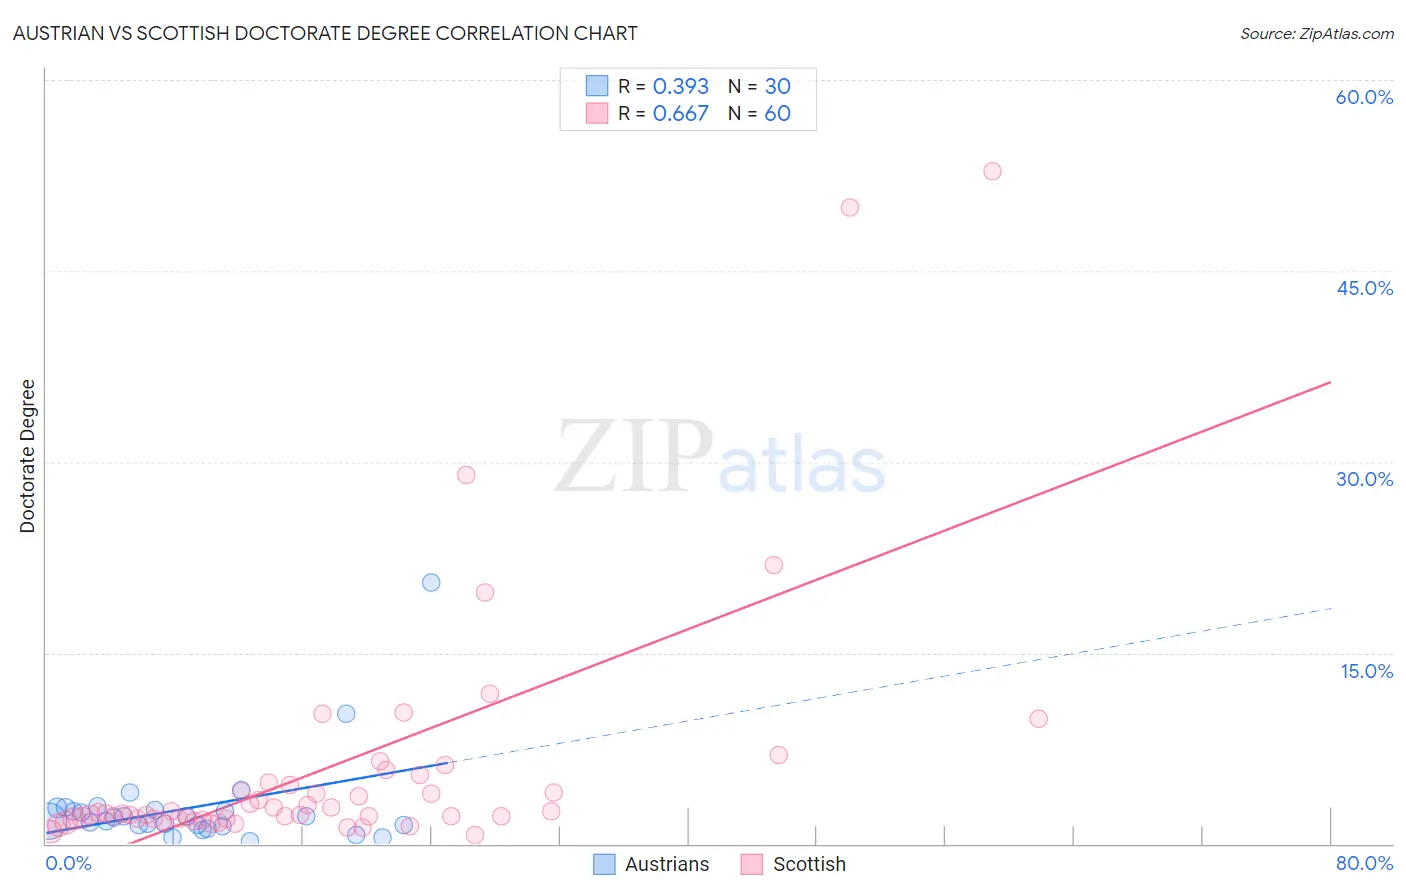
Austrian vs Scottish Doctorate Degree Correlation Chart
The statistical analysis conducted on geographies consisting of 445,801,331 people shows a mild positive correlation between the proportion of Austrians and percentage of population with at least doctorate degree education in the United States with a correlation coefficient (R) of 0.393 and weighted average of 2.1%. Similarly, the statistical analysis conducted on geographies consisting of 542,697,657 people shows a significant positive correlation between the proportion of Scottish and percentage of population with at least doctorate degree education in the United States with a correlation coefficient (R) of 0.667 and weighted average of 2.0%, a difference of 6.0%.
Doctorate Degree Correlation Summary
| Measurement | Austrian | Scottish |
| Minimum | 0.20% | 0.73% |
| Maximum | 20.5% | 52.8% |
| Range | 20.3% | 52.1% |
| Mean | 2.8% | 5.9% |
| Median | 1.9% | 2.4% |
| Interquartile 25% (IQ1) | 1.5% | 2.0% |
| Interquartile 75% (IQ3) | 2.7% | 4.7% |
| Interquartile Range (IQR) | 1.2% | 2.7% |
| Standard Deviation (Sample) | 3.8% | 9.9% |
| Standard Deviation (Population) | 3.7% | 9.9% |
Similar Demographics by Doctorate Degree
Demographics Similar to Austrians by Doctorate Degree
In terms of doctorate degree, the demographic groups most similar to Austrians are Romanian (2.1%, a difference of 0.12%), Immigrants from Chile (2.1%, a difference of 0.13%), Immigrants from Eastern Africa (2.1%, a difference of 0.35%), Arab (2.1%, a difference of 0.35%), and Immigrants from Egypt (2.1%, a difference of 0.38%).
| Demographics | Rating | Rank | Doctorate Degree |
| Immigrants | Eritrea | 98.4 /100 | #97 | Exceptional 2.1% |
| Armenians | 98.3 /100 | #98 | Exceptional 2.1% |
| Immigrants | Egypt | 98.2 /100 | #99 | Exceptional 2.1% |
| Immigrants | Eastern Europe | 98.2 /100 | #100 | Exceptional 2.1% |
| Immigrants | Eastern Africa | 98.2 /100 | #101 | Exceptional 2.1% |
| Immigrants | Chile | 98.1 /100 | #102 | Exceptional 2.1% |
| Romanians | 98.1 /100 | #103 | Exceptional 2.1% |
| Austrians | 98.0 /100 | #104 | Exceptional 2.1% |
| Arabs | 97.8 /100 | #105 | Exceptional 2.1% |
| Sudanese | 97.7 /100 | #106 | Exceptional 2.1% |
| Europeans | 97.5 /100 | #107 | Exceptional 2.1% |
| Immigrants | Germany | 97.3 /100 | #108 | Exceptional 2.1% |
| Ukrainians | 97.2 /100 | #109 | Exceptional 2.1% |
| Brazilians | 97.2 /100 | #110 | Exceptional 2.1% |
| Immigrants | Pakistan | 97.1 /100 | #111 | Exceptional 2.1% |
Demographics Similar to Scottish by Doctorate Degree
In terms of doctorate degree, the demographic groups most similar to Scottish are Immigrants from Uzbekistan (2.0%, a difference of 0.050%), Immigrants from Cameroon (2.0%, a difference of 0.20%), Serbian (2.0%, a difference of 0.26%), Immigrants from Sierra Leone (2.0%, a difference of 0.28%), and Immigrants from Ukraine (2.0%, a difference of 0.41%).
| Demographics | Rating | Rank | Doctorate Degree |
| Moroccans | 93.0 /100 | #125 | Exceptional 2.0% |
| Jordanians | 92.1 /100 | #126 | Exceptional 2.0% |
| Palestinians | 92.0 /100 | #127 | Exceptional 2.0% |
| Immigrants | Zaire | 91.1 /100 | #128 | Exceptional 2.0% |
| Canadians | 90.6 /100 | #129 | Exceptional 2.0% |
| Immigrants | Ukraine | 90.5 /100 | #130 | Exceptional 2.0% |
| Immigrants | Sierra Leone | 90.2 /100 | #131 | Exceptional 2.0% |
| Scottish | 89.4 /100 | #132 | Excellent 2.0% |
| Immigrants | Uzbekistan | 89.3 /100 | #133 | Excellent 2.0% |
| Immigrants | Cameroon | 88.9 /100 | #134 | Excellent 2.0% |
| Serbians | 88.7 /100 | #135 | Excellent 2.0% |
| Swedes | 88.3 /100 | #136 | Excellent 2.0% |
| South American Indians | 88.3 /100 | #137 | Excellent 2.0% |
| Swiss | 88.0 /100 | #138 | Excellent 2.0% |
| Afghans | 87.2 /100 | #139 | Excellent 2.0% |