Maltese vs Guatemalan College, Under 1 year
COMPARE
Maltese
Guatemalan
College, Under 1 year
College, Under 1 year Comparison
Maltese
Guatemalans
69.5%
COLLEGE, UNDER 1 YEAR
99.7/ 100
METRIC RATING
55th/ 347
METRIC RANK
56.8%
COLLEGE, UNDER 1 YEAR
0.0/ 100
METRIC RATING
320th/ 347
METRIC RANK
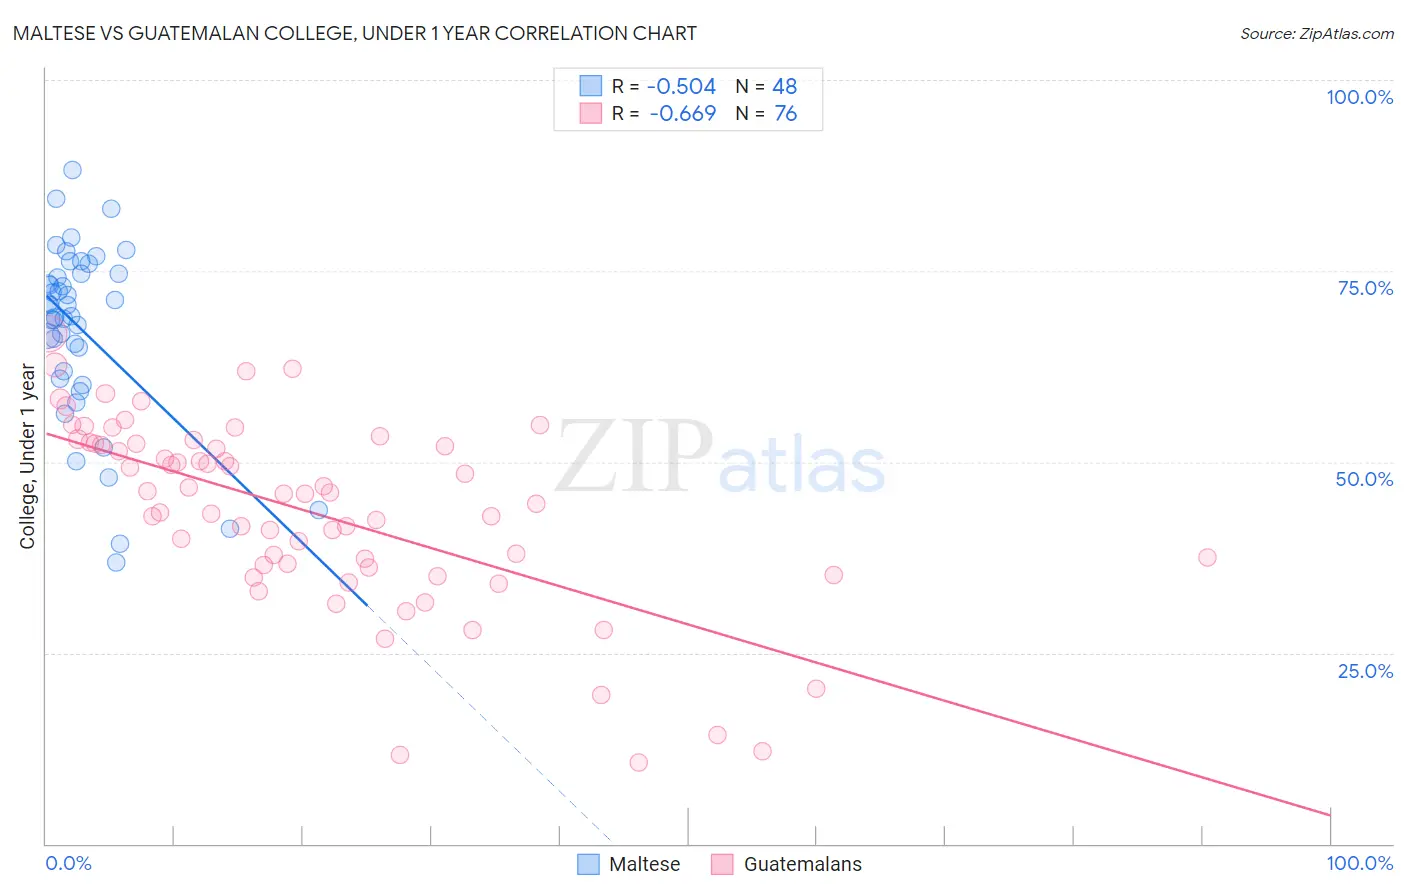
Maltese vs Guatemalan College, Under 1 year Correlation Chart
The statistical analysis conducted on geographies consisting of 126,478,070 people shows a substantial negative correlation between the proportion of Maltese and percentage of population with at least college, under 1 year education in the United States with a correlation coefficient (R) of -0.504 and weighted average of 69.5%. Similarly, the statistical analysis conducted on geographies consisting of 409,563,856 people shows a significant negative correlation between the proportion of Guatemalans and percentage of population with at least college, under 1 year education in the United States with a correlation coefficient (R) of -0.669 and weighted average of 56.8%, a difference of 22.4%.
College, Under 1 year Correlation Summary
| Measurement | Maltese | Guatemalan |
| Minimum | 36.8% | 10.7% |
| Maximum | 88.3% | 66.9% |
| Range | 51.5% | 56.2% |
| Mean | 67.2% | 43.4% |
| Median | 69.8% | 45.8% |
| Interquartile 25% (IQ1) | 61.3% | 36.4% |
| Interquartile 75% (IQ3) | 74.7% | 52.4% |
| Interquartile Range (IQR) | 13.3% | 16.0% |
| Standard Deviation (Sample) | 11.7% | 12.4% |
| Standard Deviation (Population) | 11.6% | 12.3% |
Similar Demographics by College, Under 1 year
Demographics Similar to Maltese by College, Under 1 year
In terms of college, under 1 year, the demographic groups most similar to Maltese are Immigrants from Czechoslovakia (69.6%, a difference of 0.10%), Immigrants from Scotland (69.4%, a difference of 0.12%), Asian (69.4%, a difference of 0.14%), South African (69.7%, a difference of 0.22%), and Immigrants from Malaysia (69.3%, a difference of 0.24%).
| Demographics | Rating | Rank | College, Under 1 year |
| Immigrants | Netherlands | 99.8 /100 | #48 | Exceptional 70.0% |
| Immigrants | Austria | 99.8 /100 | #49 | Exceptional 70.0% |
| Zimbabweans | 99.8 /100 | #50 | Exceptional 69.9% |
| Mongolians | 99.8 /100 | #51 | Exceptional 69.9% |
| Immigrants | Russia | 99.8 /100 | #52 | Exceptional 69.9% |
| South Africans | 99.7 /100 | #53 | Exceptional 69.7% |
| Immigrants | Czechoslovakia | 99.7 /100 | #54 | Exceptional 69.6% |
| Maltese | 99.7 /100 | #55 | Exceptional 69.5% |
| Immigrants | Scotland | 99.6 /100 | #56 | Exceptional 69.4% |
| Asians | 99.6 /100 | #57 | Exceptional 69.4% |
| Immigrants | Malaysia | 99.6 /100 | #58 | Exceptional 69.3% |
| Immigrants | Serbia | 99.5 /100 | #59 | Exceptional 69.3% |
| Immigrants | Asia | 99.5 /100 | #60 | Exceptional 69.2% |
| Immigrants | Kazakhstan | 99.5 /100 | #61 | Exceptional 69.2% |
| Immigrants | Belarus | 99.5 /100 | #62 | Exceptional 69.2% |
Demographics Similar to Guatemalans by College, Under 1 year
In terms of college, under 1 year, the demographic groups most similar to Guatemalans are Puerto Rican (56.8%, a difference of 0.060%), Native/Alaskan (56.6%, a difference of 0.26%), Immigrants from Haiti (56.9%, a difference of 0.27%), Hispanic or Latino (57.0%, a difference of 0.38%), and Immigrants from Caribbean (56.6%, a difference of 0.39%).
| Demographics | Rating | Rank | College, Under 1 year |
| Dutch West Indians | 0.0 /100 | #313 | Tragic 57.2% |
| Hopi | 0.0 /100 | #314 | Tragic 57.1% |
| Hondurans | 0.0 /100 | #315 | Tragic 57.1% |
| Menominee | 0.0 /100 | #316 | Tragic 57.0% |
| Hispanics or Latinos | 0.0 /100 | #317 | Tragic 57.0% |
| Immigrants | Haiti | 0.0 /100 | #318 | Tragic 56.9% |
| Puerto Ricans | 0.0 /100 | #319 | Tragic 56.8% |
| Guatemalans | 0.0 /100 | #320 | Tragic 56.8% |
| Natives/Alaskans | 0.0 /100 | #321 | Tragic 56.6% |
| Immigrants | Caribbean | 0.0 /100 | #322 | Tragic 56.6% |
| Immigrants | Honduras | 0.0 /100 | #323 | Tragic 56.5% |
| Immigrants | El Salvador | 0.0 /100 | #324 | Tragic 56.4% |
| Immigrants | Latin America | 0.0 /100 | #325 | Tragic 56.3% |
| Navajo | 0.0 /100 | #326 | Tragic 56.3% |
| Immigrants | Guatemala | 0.0 /100 | #327 | Tragic 56.2% |