Immigrants from Jordan vs Immigrants from Japan No Schooling Completed
COMPARE
Immigrants from Jordan
Immigrants from Japan
No Schooling Completed
No Schooling Completed Comparison
Immigrants from Jordan
Immigrants from Japan
2.0%
NO SCHOOLING COMPLETED
70.9/ 100
METRIC RATING
151st/ 347
METRIC RANK
1.9%
NO SCHOOLING COMPLETED
96.6/ 100
METRIC RATING
111th/ 347
METRIC RANK
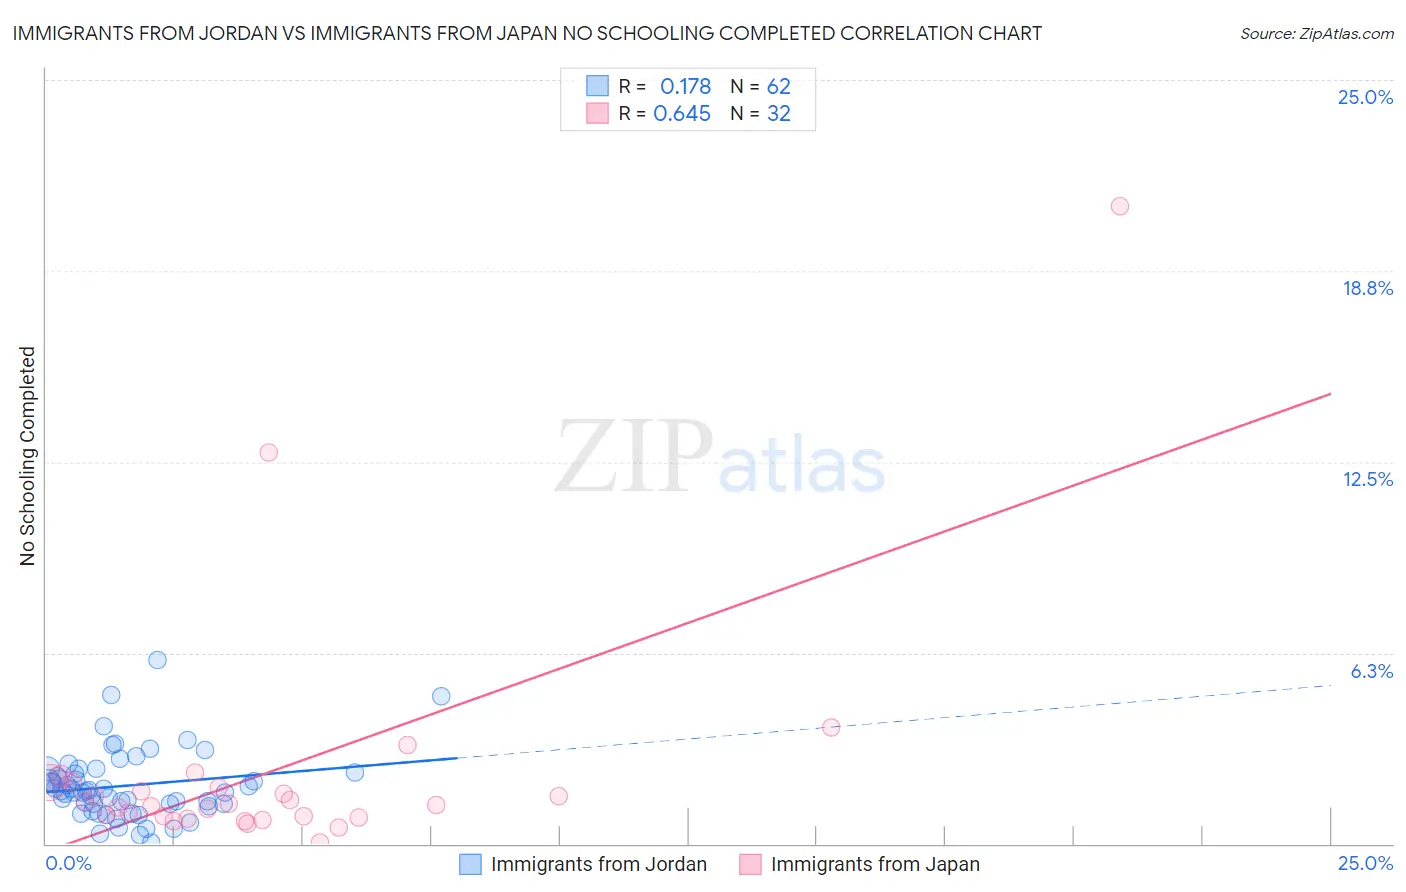
Immigrants from Jordan vs Immigrants from Japan No Schooling Completed Correlation Chart
The statistical analysis conducted on geographies consisting of 180,880,658 people shows a poor positive correlation between the proportion of Immigrants from Jordan and percentage of population with no schooling in the United States with a correlation coefficient (R) of 0.178 and weighted average of 2.0%. Similarly, the statistical analysis conducted on geographies consisting of 337,168,238 people shows a significant positive correlation between the proportion of Immigrants from Japan and percentage of population with no schooling in the United States with a correlation coefficient (R) of 0.645 and weighted average of 1.9%, a difference of 9.2%.
No Schooling Completed Correlation Summary
| Measurement | Immigrants from Jordan | Immigrants from Japan |
| Minimum | 0.047% | 0.022% |
| Maximum | 6.0% | 20.9% |
| Range | 6.0% | 20.9% |
| Mean | 1.9% | 2.4% |
| Median | 1.7% | 1.3% |
| Interquartile 25% (IQ1) | 1.3% | 0.88% |
| Interquartile 75% (IQ3) | 2.3% | 1.9% |
| Interquartile Range (IQR) | 1.0% | 1.0% |
| Standard Deviation (Sample) | 1.1% | 4.0% |
| Standard Deviation (Population) | 1.1% | 3.9% |
Similar Demographics by No Schooling Completed
Demographics Similar to Immigrants from Jordan by No Schooling Completed
In terms of no schooling completed, the demographic groups most similar to Immigrants from Jordan are Immigrants from Eastern Europe (2.0%, a difference of 0.090%), Immigrants from Italy (2.0%, a difference of 0.33%), Blackfeet (2.0%, a difference of 0.34%), Immigrants from Venezuela (2.0%, a difference of 0.39%), and Immigrants from Russia (2.0%, a difference of 0.53%).
| Demographics | Rating | Rank | No Schooling Completed |
| Alsatians | 79.1 /100 | #144 | Good 2.0% |
| Immigrants | Iran | 79.0 /100 | #145 | Good 2.0% |
| Immigrants | Moldova | 78.0 /100 | #146 | Good 2.0% |
| Soviet Union | 77.1 /100 | #147 | Good 2.0% |
| Shoshone | 76.7 /100 | #148 | Good 2.0% |
| Immigrants | North Macedonia | 75.9 /100 | #149 | Good 2.0% |
| Blackfeet | 72.9 /100 | #150 | Good 2.0% |
| Immigrants | Jordan | 70.9 /100 | #151 | Good 2.0% |
| Immigrants | Eastern Europe | 70.4 /100 | #152 | Good 2.0% |
| Immigrants | Italy | 68.9 /100 | #153 | Good 2.0% |
| Immigrants | Venezuela | 68.5 /100 | #154 | Good 2.0% |
| Immigrants | Russia | 67.6 /100 | #155 | Good 2.0% |
| Chileans | 67.2 /100 | #156 | Good 2.0% |
| Immigrants | Sri Lanka | 67.0 /100 | #157 | Good 2.0% |
| Immigrants | Korea | 66.7 /100 | #158 | Good 2.0% |
Demographics Similar to Immigrants from Japan by No Schooling Completed
In terms of no schooling completed, the demographic groups most similar to Immigrants from Japan are Immigrants from Latvia (1.9%, a difference of 0.15%), Pueblo (1.9%, a difference of 0.19%), Immigrants from Saudi Arabia (1.9%, a difference of 0.28%), Immigrants from Zimbabwe (1.9%, a difference of 0.43%), and Immigrants from Norway (1.9%, a difference of 0.44%).
| Demographics | Rating | Rank | No Schooling Completed |
| Thais | 97.5 /100 | #104 | Exceptional 1.8% |
| German Russians | 97.5 /100 | #105 | Exceptional 1.8% |
| Immigrants | France | 97.3 /100 | #106 | Exceptional 1.8% |
| Yugoslavians | 97.2 /100 | #107 | Exceptional 1.8% |
| Okinawans | 97.1 /100 | #108 | Exceptional 1.8% |
| Immigrants | Saudi Arabia | 96.8 /100 | #109 | Exceptional 1.9% |
| Immigrants | Latvia | 96.7 /100 | #110 | Exceptional 1.9% |
| Immigrants | Japan | 96.6 /100 | #111 | Exceptional 1.9% |
| Pueblo | 96.4 /100 | #112 | Exceptional 1.9% |
| Immigrants | Zimbabwe | 96.2 /100 | #113 | Exceptional 1.9% |
| Immigrants | Norway | 96.1 /100 | #114 | Exceptional 1.9% |
| Syrians | 96.0 /100 | #115 | Exceptional 1.9% |
| Lebanese | 96.0 /100 | #116 | Exceptional 1.9% |
| Immigrants | Serbia | 95.8 /100 | #117 | Exceptional 1.9% |
| Spanish | 95.5 /100 | #118 | Exceptional 1.9% |