South American Indian vs Chinese Associate's Degree
COMPARE
South American Indian
Chinese
Associate's Degree
Associate's Degree Comparison
South American Indians
Chinese
47.4%
ASSOCIATE'S DEGREE
76.7/ 100
METRIC RATING
148th/ 347
METRIC RANK
48.5%
ASSOCIATE'S DEGREE
92.5/ 100
METRIC RATING
125th/ 347
METRIC RANK
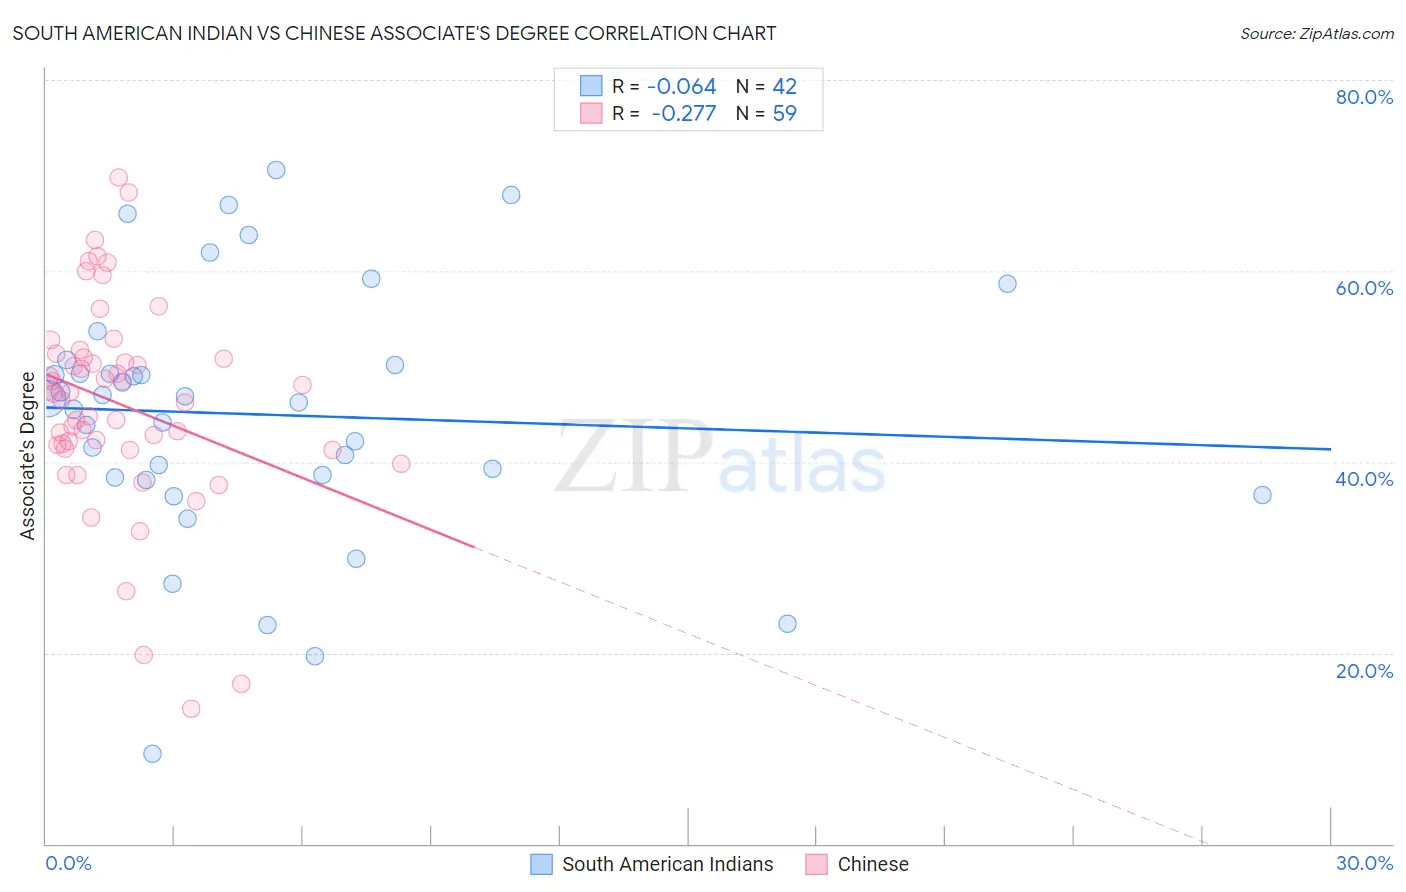
South American Indian vs Chinese Associate's Degree Correlation Chart
The statistical analysis conducted on geographies consisting of 164,573,088 people shows a slight negative correlation between the proportion of South American Indians and percentage of population with at least associate's degree education in the United States with a correlation coefficient (R) of -0.064 and weighted average of 47.4%. Similarly, the statistical analysis conducted on geographies consisting of 64,809,883 people shows a weak negative correlation between the proportion of Chinese and percentage of population with at least associate's degree education in the United States with a correlation coefficient (R) of -0.277 and weighted average of 48.5%, a difference of 2.4%.
Associate's Degree Correlation Summary
| Measurement | South American Indian | Chinese |
| Minimum | 9.4% | 14.2% |
| Maximum | 70.6% | 69.8% |
| Range | 61.2% | 55.6% |
| Mean | 45.0% | 46.1% |
| Median | 46.5% | 47.1% |
| Interquartile 25% (IQ1) | 38.4% | 41.4% |
| Interquartile 75% (IQ3) | 50.2% | 50.9% |
| Interquartile Range (IQR) | 11.8% | 9.5% |
| Standard Deviation (Sample) | 13.3% | 10.8% |
| Standard Deviation (Population) | 13.2% | 10.7% |
Similar Demographics by Associate's Degree
Demographics Similar to South American Indians by Associate's Degree
In terms of associate's degree, the demographic groups most similar to South American Indians are Immigrants from Armenia (47.4%, a difference of 0.010%), Iraqi (47.4%, a difference of 0.050%), Danish (47.4%, a difference of 0.060%), Immigrants from North Macedonia (47.4%, a difference of 0.070%), and Immigrants from Sudan (47.4%, a difference of 0.12%).
| Demographics | Rating | Rank | Associate's Degree |
| Taiwanese | 83.3 /100 | #141 | Excellent 47.7% |
| Sierra Leoneans | 82.9 /100 | #142 | Excellent 47.7% |
| Norwegians | 81.0 /100 | #143 | Excellent 47.6% |
| Slavs | 80.5 /100 | #144 | Excellent 47.6% |
| Canadians | 79.0 /100 | #145 | Good 47.5% |
| Immigrants | Sudan | 77.9 /100 | #146 | Good 47.4% |
| Danes | 77.3 /100 | #147 | Good 47.4% |
| South American Indians | 76.7 /100 | #148 | Good 47.4% |
| Immigrants | Armenia | 76.6 /100 | #149 | Good 47.4% |
| Iraqis | 76.2 /100 | #150 | Good 47.4% |
| Immigrants | North Macedonia | 76.0 /100 | #151 | Good 47.4% |
| Immigrants | Afghanistan | 74.3 /100 | #152 | Good 47.3% |
| Czechs | 72.2 /100 | #153 | Good 47.2% |
| Immigrants | Kenya | 72.1 /100 | #154 | Good 47.2% |
| Kenyans | 70.6 /100 | #155 | Good 47.1% |
Demographics Similar to Chinese by Associate's Degree
In terms of associate's degree, the demographic groups most similar to Chinese are Serbian (48.5%, a difference of 0.020%), Immigrants from Syria (48.5%, a difference of 0.090%), Immigrants from Uganda (48.5%, a difference of 0.10%), Immigrants from Eastern Africa (48.4%, a difference of 0.22%), and Swedish (48.4%, a difference of 0.25%).
| Demographics | Rating | Rank | Associate's Degree |
| Albanians | 94.7 /100 | #118 | Exceptional 48.8% |
| Lebanese | 94.6 /100 | #119 | Exceptional 48.8% |
| Alsatians | 94.6 /100 | #120 | Exceptional 48.8% |
| Ugandans | 93.9 /100 | #121 | Exceptional 48.7% |
| Italians | 93.9 /100 | #122 | Exceptional 48.7% |
| Brazilians | 93.7 /100 | #123 | Exceptional 48.7% |
| Serbians | 92.6 /100 | #124 | Exceptional 48.5% |
| Chinese | 92.5 /100 | #125 | Exceptional 48.5% |
| Immigrants | Syria | 92.2 /100 | #126 | Exceptional 48.5% |
| Immigrants | Uganda | 92.1 /100 | #127 | Exceptional 48.5% |
| Immigrants | Eastern Africa | 91.6 /100 | #128 | Exceptional 48.4% |
| Swedes | 91.5 /100 | #129 | Exceptional 48.4% |
| Immigrants | Jordan | 91.2 /100 | #130 | Exceptional 48.4% |
| Icelanders | 90.8 /100 | #131 | Exceptional 48.3% |
| Immigrants | Albania | 89.9 /100 | #132 | Excellent 48.2% |