Malaysian vs Immigrants from Portugal GED/Equivalency
COMPARE
Malaysian
Immigrants from Portugal
GED/Equivalency
GED/Equivalency Comparison
Malaysians
Immigrants from Portugal
83.3%
GED/EQUIVALENCY
0.4/ 100
METRIC RATING
258th/ 347
METRIC RANK
81.6%
GED/EQUIVALENCY
0.0/ 100
METRIC RATING
303rd/ 347
METRIC RANK
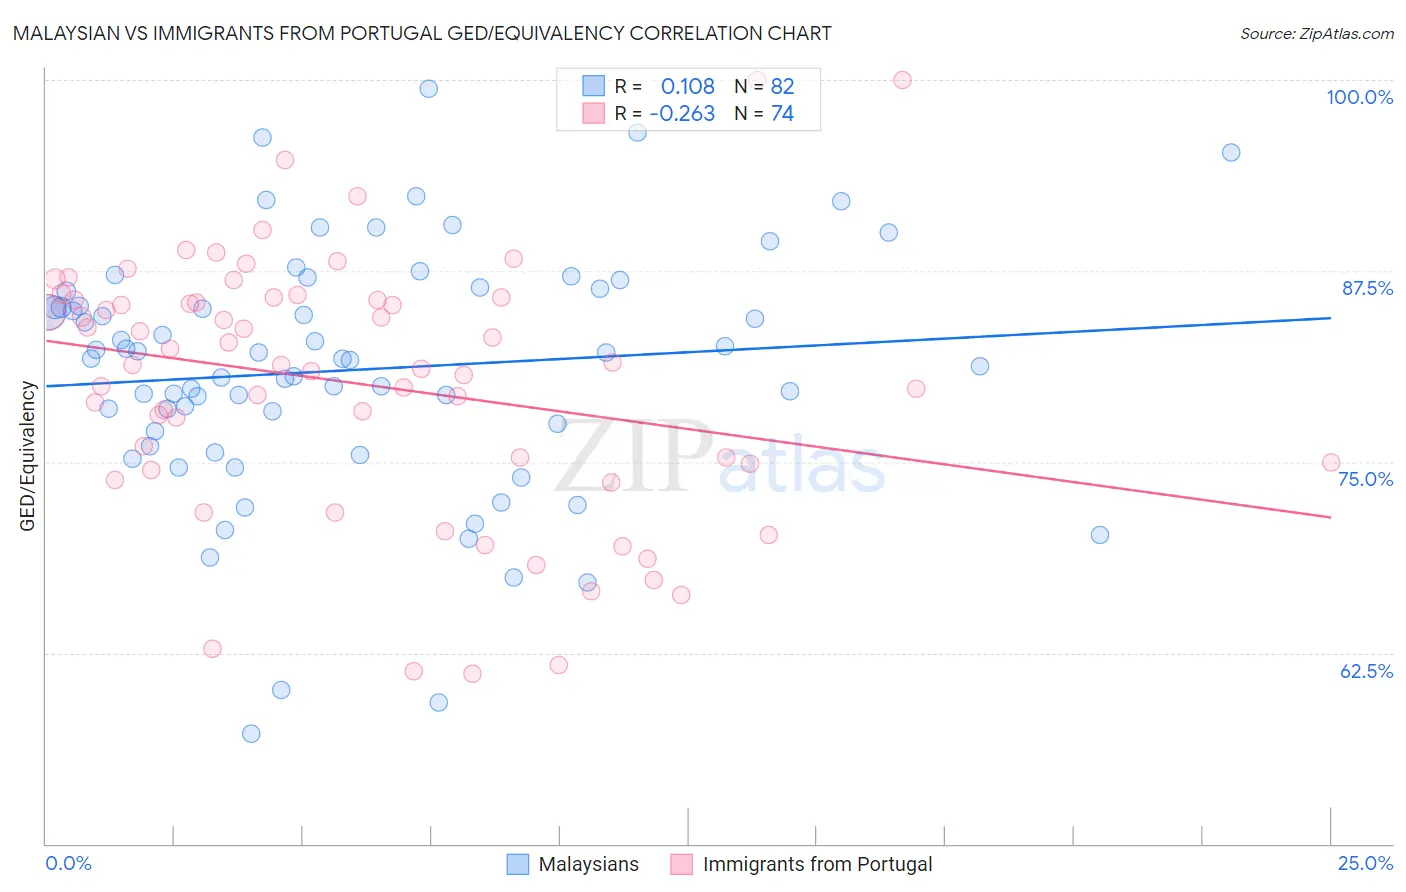
Malaysian vs Immigrants from Portugal GED/Equivalency Correlation Chart
The statistical analysis conducted on geographies consisting of 226,108,706 people shows a poor positive correlation between the proportion of Malaysians and percentage of population with at least ged/equivalency education in the United States with a correlation coefficient (R) of 0.108 and weighted average of 83.3%. Similarly, the statistical analysis conducted on geographies consisting of 174,792,669 people shows a weak negative correlation between the proportion of Immigrants from Portugal and percentage of population with at least ged/equivalency education in the United States with a correlation coefficient (R) of -0.263 and weighted average of 81.6%, a difference of 2.1%.
GED/Equivalency Correlation Summary
| Measurement | Malaysian | Immigrants from Portugal |
| Minimum | 57.2% | 61.1% |
| Maximum | 99.4% | 100.0% |
| Range | 42.2% | 38.9% |
| Mean | 81.0% | 80.1% |
| Median | 81.7% | 81.3% |
| Interquartile 25% (IQ1) | 77.0% | 74.9% |
| Interquartile 75% (IQ3) | 86.1% | 85.6% |
| Interquartile Range (IQR) | 9.2% | 10.7% |
| Standard Deviation (Sample) | 8.1% | 8.5% |
| Standard Deviation (Population) | 8.0% | 8.4% |
Similar Demographics by GED/Equivalency
Demographics Similar to Malaysians by GED/Equivalency
In terms of ged/equivalency, the demographic groups most similar to Malaysians are Jamaican (83.3%, a difference of 0.030%), Immigrants from Vietnam (83.2%, a difference of 0.14%), African (83.4%, a difference of 0.16%), Colville (83.4%, a difference of 0.17%), and Choctaw (83.1%, a difference of 0.17%).
| Demographics | Rating | Rank | GED/Equivalency |
| Spanish Americans | 0.8 /100 | #251 | Tragic 83.6% |
| Bahamians | 0.8 /100 | #252 | Tragic 83.6% |
| Comanche | 0.7 /100 | #253 | Tragic 83.6% |
| Creek | 0.7 /100 | #254 | Tragic 83.6% |
| Colville | 0.5 /100 | #255 | Tragic 83.4% |
| Africans | 0.5 /100 | #256 | Tragic 83.4% |
| Jamaicans | 0.4 /100 | #257 | Tragic 83.3% |
| Malaysians | 0.4 /100 | #258 | Tragic 83.3% |
| Immigrants | Vietnam | 0.3 /100 | #259 | Tragic 83.2% |
| Choctaw | 0.3 /100 | #260 | Tragic 83.1% |
| Inupiat | 0.2 /100 | #261 | Tragic 83.1% |
| Immigrants | Armenia | 0.2 /100 | #262 | Tragic 83.1% |
| Immigrants | Congo | 0.2 /100 | #263 | Tragic 83.1% |
| Bangladeshis | 0.2 /100 | #264 | Tragic 83.1% |
| West Indians | 0.2 /100 | #265 | Tragic 83.1% |
Demographics Similar to Immigrants from Portugal by GED/Equivalency
In terms of ged/equivalency, the demographic groups most similar to Immigrants from Portugal are Immigrants from Haiti (81.6%, a difference of 0.0%), Dutch West Indian (81.6%, a difference of 0.040%), Fijian (81.6%, a difference of 0.10%), Navajo (81.5%, a difference of 0.10%), and Ecuadorian (81.7%, a difference of 0.17%).
| Demographics | Rating | Rank | GED/Equivalency |
| Vietnamese | 0.0 /100 | #296 | Tragic 81.9% |
| Immigrants | Bangladesh | 0.0 /100 | #297 | Tragic 81.9% |
| Ute | 0.0 /100 | #298 | Tragic 81.8% |
| Ecuadorians | 0.0 /100 | #299 | Tragic 81.7% |
| Fijians | 0.0 /100 | #300 | Tragic 81.6% |
| Dutch West Indians | 0.0 /100 | #301 | Tragic 81.6% |
| Immigrants | Haiti | 0.0 /100 | #302 | Tragic 81.6% |
| Immigrants | Portugal | 0.0 /100 | #303 | Tragic 81.6% |
| Navajo | 0.0 /100 | #304 | Tragic 81.5% |
| Immigrants | Grenada | 0.0 /100 | #305 | Tragic 81.3% |
| Guyanese | 0.0 /100 | #306 | Tragic 81.3% |
| Immigrants | Dominica | 0.0 /100 | #307 | Tragic 81.1% |
| Puerto Ricans | 0.0 /100 | #308 | Tragic 81.1% |
| Immigrants | Ecuador | 0.0 /100 | #309 | Tragic 81.0% |
| Immigrants | Guyana | 0.0 /100 | #310 | Tragic 81.0% |