Immigrants from Latvia vs Mexican American Indian Doctorate Degree
COMPARE
Immigrants from Latvia
Mexican American Indian
Doctorate Degree
Doctorate Degree Comparison
Immigrants from Latvia
Mexican American Indians
2.4%
DOCTORATE DEGREE
100.0/ 100
METRIC RATING
53rd/ 347
METRIC RANK
1.4%
DOCTORATE DEGREE
0.1/ 100
METRIC RATING
304th/ 347
METRIC RANK
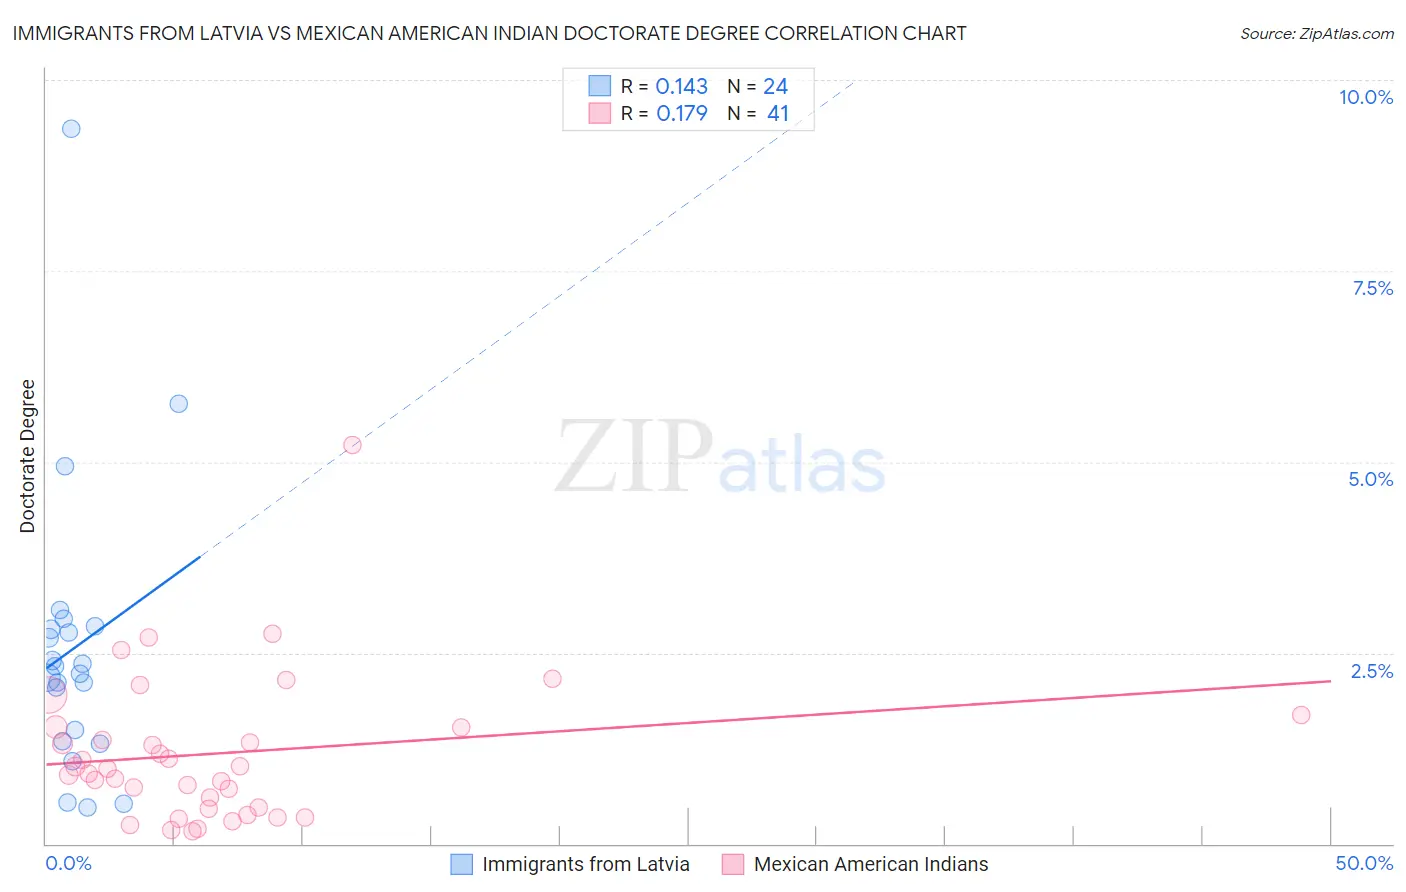
Immigrants from Latvia vs Mexican American Indian Doctorate Degree Correlation Chart
The statistical analysis conducted on geographies consisting of 113,595,553 people shows a poor positive correlation between the proportion of Immigrants from Latvia and percentage of population with at least doctorate degree education in the United States with a correlation coefficient (R) of 0.143 and weighted average of 2.4%. Similarly, the statistical analysis conducted on geographies consisting of 313,619,583 people shows a poor positive correlation between the proportion of Mexican American Indians and percentage of population with at least doctorate degree education in the United States with a correlation coefficient (R) of 0.179 and weighted average of 1.4%, a difference of 72.4%.
Doctorate Degree Correlation Summary
| Measurement | Immigrants from Latvia | Mexican American Indian |
| Minimum | 0.48% | 0.17% |
| Maximum | 9.4% | 5.2% |
| Range | 8.9% | 5.1% |
| Mean | 2.6% | 1.2% |
| Median | 2.3% | 0.98% |
| Interquartile 25% (IQ1) | 1.4% | 0.47% |
| Interquartile 75% (IQ3) | 2.8% | 1.5% |
| Interquartile Range (IQR) | 1.4% | 1.1% |
| Standard Deviation (Sample) | 1.9% | 0.96% |
| Standard Deviation (Population) | 1.9% | 0.95% |
Similar Demographics by Doctorate Degree
Demographics Similar to Immigrants from Latvia by Doctorate Degree
In terms of doctorate degree, the demographic groups most similar to Immigrants from Latvia are Bulgarian (2.4%, a difference of 0.12%), Australian (2.4%, a difference of 0.59%), Immigrants from Norway (2.4%, a difference of 0.68%), Immigrants from Indonesia (2.4%, a difference of 0.68%), and Bolivian (2.4%, a difference of 0.76%).
| Demographics | Rating | Rank | Doctorate Degree |
| Immigrants | Austria | 100.0 /100 | #46 | Exceptional 2.4% |
| Immigrants | Western Europe | 100.0 /100 | #47 | Exceptional 2.4% |
| Asians | 100.0 /100 | #48 | Exceptional 2.4% |
| Immigrants | Asia | 100.0 /100 | #49 | Exceptional 2.4% |
| Immigrants | Norway | 100.0 /100 | #50 | Exceptional 2.4% |
| Australians | 100.0 /100 | #51 | Exceptional 2.4% |
| Bulgarians | 100.0 /100 | #52 | Exceptional 2.4% |
| Immigrants | Latvia | 100.0 /100 | #53 | Exceptional 2.4% |
| Immigrants | Indonesia | 100.0 /100 | #54 | Exceptional 2.4% |
| Bolivians | 100.0 /100 | #55 | Exceptional 2.4% |
| Immigrants | Czechoslovakia | 100.0 /100 | #56 | Exceptional 2.4% |
| Immigrants | Ethiopia | 100.0 /100 | #57 | Exceptional 2.4% |
| Ethiopians | 99.9 /100 | #58 | Exceptional 2.3% |
| South Africans | 99.9 /100 | #59 | Exceptional 2.3% |
| Immigrants | Serbia | 99.9 /100 | #60 | Exceptional 2.3% |
Demographics Similar to Mexican American Indians by Doctorate Degree
In terms of doctorate degree, the demographic groups most similar to Mexican American Indians are Immigrants from Dominica (1.4%, a difference of 0.060%), Shoshone (1.4%, a difference of 0.090%), Pennsylvania German (1.4%, a difference of 0.13%), Guyanese (1.4%, a difference of 0.15%), and Cuban (1.4%, a difference of 0.40%).
| Demographics | Rating | Rank | Doctorate Degree |
| Tsimshian | 0.2 /100 | #297 | Tragic 1.4% |
| Puerto Ricans | 0.1 /100 | #298 | Tragic 1.4% |
| Belizeans | 0.1 /100 | #299 | Tragic 1.4% |
| Immigrants | Guatemala | 0.1 /100 | #300 | Tragic 1.4% |
| Hondurans | 0.1 /100 | #301 | Tragic 1.4% |
| Shoshone | 0.1 /100 | #302 | Tragic 1.4% |
| Immigrants | Dominica | 0.1 /100 | #303 | Tragic 1.4% |
| Mexican American Indians | 0.1 /100 | #304 | Tragic 1.4% |
| Pennsylvania Germans | 0.1 /100 | #305 | Tragic 1.4% |
| Guyanese | 0.1 /100 | #306 | Tragic 1.4% |
| Cubans | 0.1 /100 | #307 | Tragic 1.4% |
| Immigrants | Laos | 0.1 /100 | #308 | Tragic 1.4% |
| Immigrants | Grenada | 0.1 /100 | #309 | Tragic 1.4% |
| Immigrants | Jamaica | 0.1 /100 | #310 | Tragic 1.4% |
| Immigrants | Honduras | 0.1 /100 | #311 | Tragic 1.4% |