Malaysian vs English 6th Grade
COMPARE
Malaysian
English
6th Grade
6th Grade Comparison
Malaysians
English
96.2%
6TH GRADE
0.0/ 100
METRIC RATING
288th/ 347
METRIC RANK
98.1%
6TH GRADE
100.0/ 100
METRIC RATING
11th/ 347
METRIC RANK
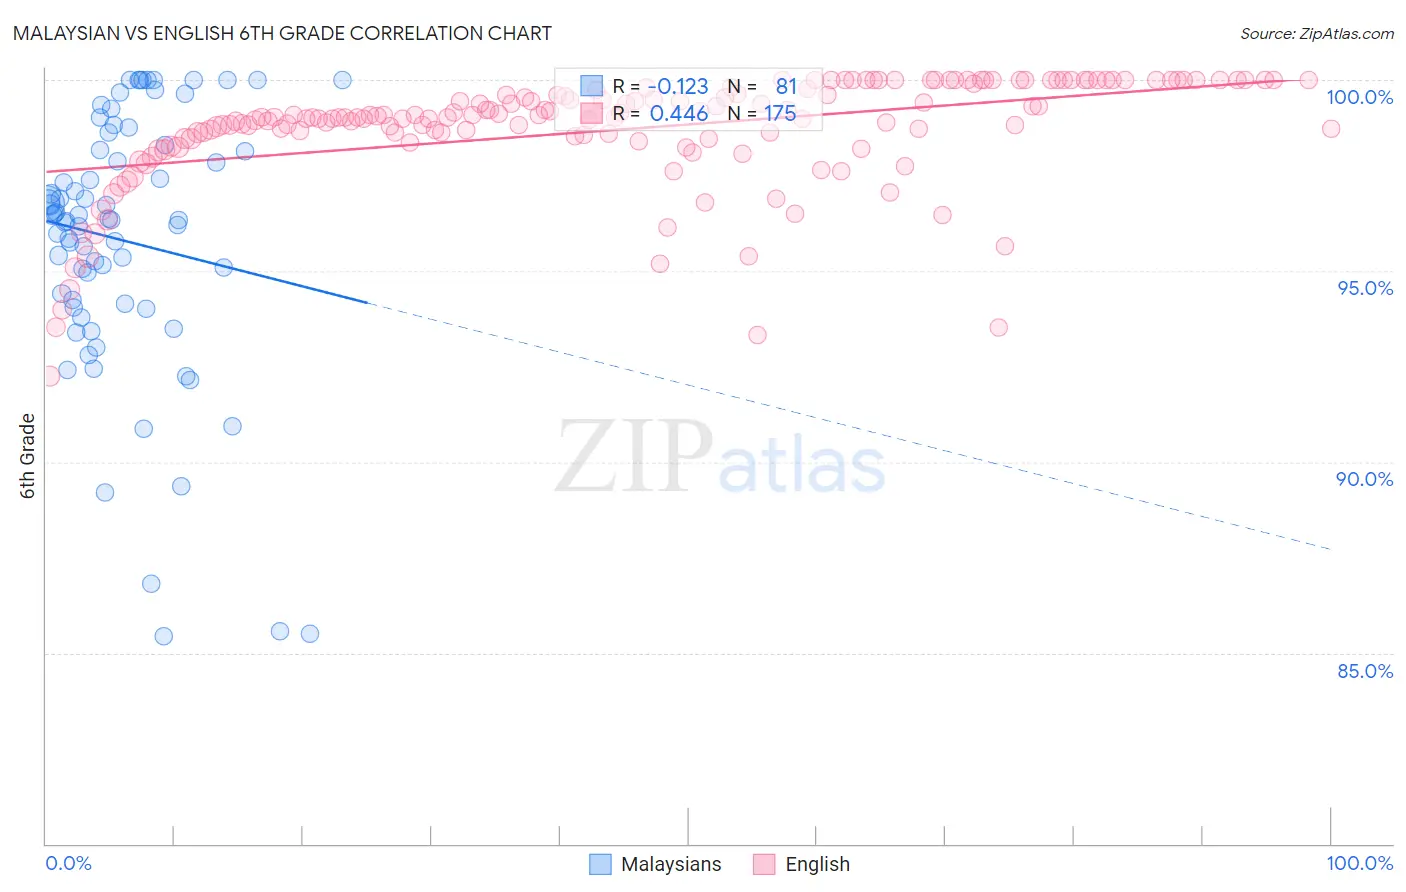
Malaysian vs English 6th Grade Correlation Chart
The statistical analysis conducted on geographies consisting of 226,107,000 people shows a poor negative correlation between the proportion of Malaysians and percentage of population with at least 6th grade education in the United States with a correlation coefficient (R) of -0.123 and weighted average of 96.2%. Similarly, the statistical analysis conducted on geographies consisting of 579,981,272 people shows a moderate positive correlation between the proportion of English and percentage of population with at least 6th grade education in the United States with a correlation coefficient (R) of 0.446 and weighted average of 98.1%, a difference of 2.1%.
6th Grade Correlation Summary
| Measurement | Malaysian | English |
| Minimum | 85.4% | 92.3% |
| Maximum | 100.0% | 100.0% |
| Range | 14.6% | 7.7% |
| Mean | 95.8% | 98.7% |
| Median | 96.3% | 99.0% |
| Interquartile 25% (IQ1) | 94.1% | 98.5% |
| Interquartile 75% (IQ3) | 98.2% | 99.8% |
| Interquartile Range (IQR) | 4.2% | 1.3% |
| Standard Deviation (Sample) | 3.5% | 1.5% |
| Standard Deviation (Population) | 3.4% | 1.5% |
Similar Demographics by 6th Grade
Demographics Similar to Malaysians by 6th Grade
In terms of 6th grade, the demographic groups most similar to Malaysians are Immigrants from Trinidad and Tobago (96.2%, a difference of 0.010%), Barbadian (96.2%, a difference of 0.020%), Immigrants from Eritrea (96.1%, a difference of 0.020%), Immigrants from Somalia (96.1%, a difference of 0.040%), and Immigrants from St. Vincent and the Grenadines (96.1%, a difference of 0.040%).
| Demographics | Rating | Rank | 6th Grade |
| Trinidadians and Tobagonians | 0.1 /100 | #281 | Tragic 96.2% |
| Houma | 0.1 /100 | #282 | Tragic 96.2% |
| Cubans | 0.1 /100 | #283 | Tragic 96.2% |
| Fijians | 0.1 /100 | #284 | Tragic 96.2% |
| Somalis | 0.1 /100 | #285 | Tragic 96.2% |
| Barbadians | 0.0 /100 | #286 | Tragic 96.2% |
| Immigrants | Trinidad and Tobago | 0.0 /100 | #287 | Tragic 96.2% |
| Malaysians | 0.0 /100 | #288 | Tragic 96.2% |
| Immigrants | Eritrea | 0.0 /100 | #289 | Tragic 96.1% |
| Immigrants | Somalia | 0.0 /100 | #290 | Tragic 96.1% |
| Immigrants | St. Vincent and the Grenadines | 0.0 /100 | #291 | Tragic 96.1% |
| Immigrants | Barbados | 0.0 /100 | #292 | Tragic 96.1% |
| Immigrants | West Indies | 0.0 /100 | #293 | Tragic 96.1% |
| British West Indians | 0.0 /100 | #294 | Tragic 96.0% |
| Immigrants | Grenada | 0.0 /100 | #295 | Tragic 95.9% |
Demographics Similar to English by 6th Grade
In terms of 6th grade, the demographic groups most similar to English are Swedish (98.2%, a difference of 0.010%), Alaskan Athabascan (98.1%, a difference of 0.010%), Tlingit-Haida (98.1%, a difference of 0.020%), Carpatho Rusyn (98.1%, a difference of 0.030%), and Slovene (98.2%, a difference of 0.040%).
| Demographics | Rating | Rank | 6th Grade |
| Dutch | 100.0 /100 | #4 | Exceptional 98.4% |
| Tsimshian | 100.0 /100 | #5 | Exceptional 98.3% |
| Norwegians | 100.0 /100 | #6 | Exceptional 98.3% |
| Germans | 100.0 /100 | #7 | Exceptional 98.2% |
| Slovaks | 100.0 /100 | #8 | Exceptional 98.2% |
| Slovenes | 100.0 /100 | #9 | Exceptional 98.2% |
| Swedes | 100.0 /100 | #10 | Exceptional 98.2% |
| English | 100.0 /100 | #11 | Exceptional 98.1% |
| Alaskan Athabascans | 100.0 /100 | #12 | Exceptional 98.1% |
| Tlingit-Haida | 100.0 /100 | #13 | Exceptional 98.1% |
| Carpatho Rusyns | 100.0 /100 | #14 | Exceptional 98.1% |
| Inupiat | 100.0 /100 | #15 | Exceptional 98.1% |
| Scottish | 100.0 /100 | #16 | Exceptional 98.1% |
| Poles | 100.0 /100 | #17 | Exceptional 98.1% |
| Pennsylvania Germans | 100.0 /100 | #18 | Exceptional 98.1% |