Pakistani vs Immigrants from Sudan 6th Grade
COMPARE
Pakistani
Immigrants from Sudan
6th Grade
6th Grade Comparison
Pakistanis
Immigrants from Sudan
97.0%
6TH GRADE
46.0/ 100
METRIC RATING
178th/ 347
METRIC RANK
96.8%
6TH GRADE
8.7/ 100
METRIC RATING
213th/ 347
METRIC RANK
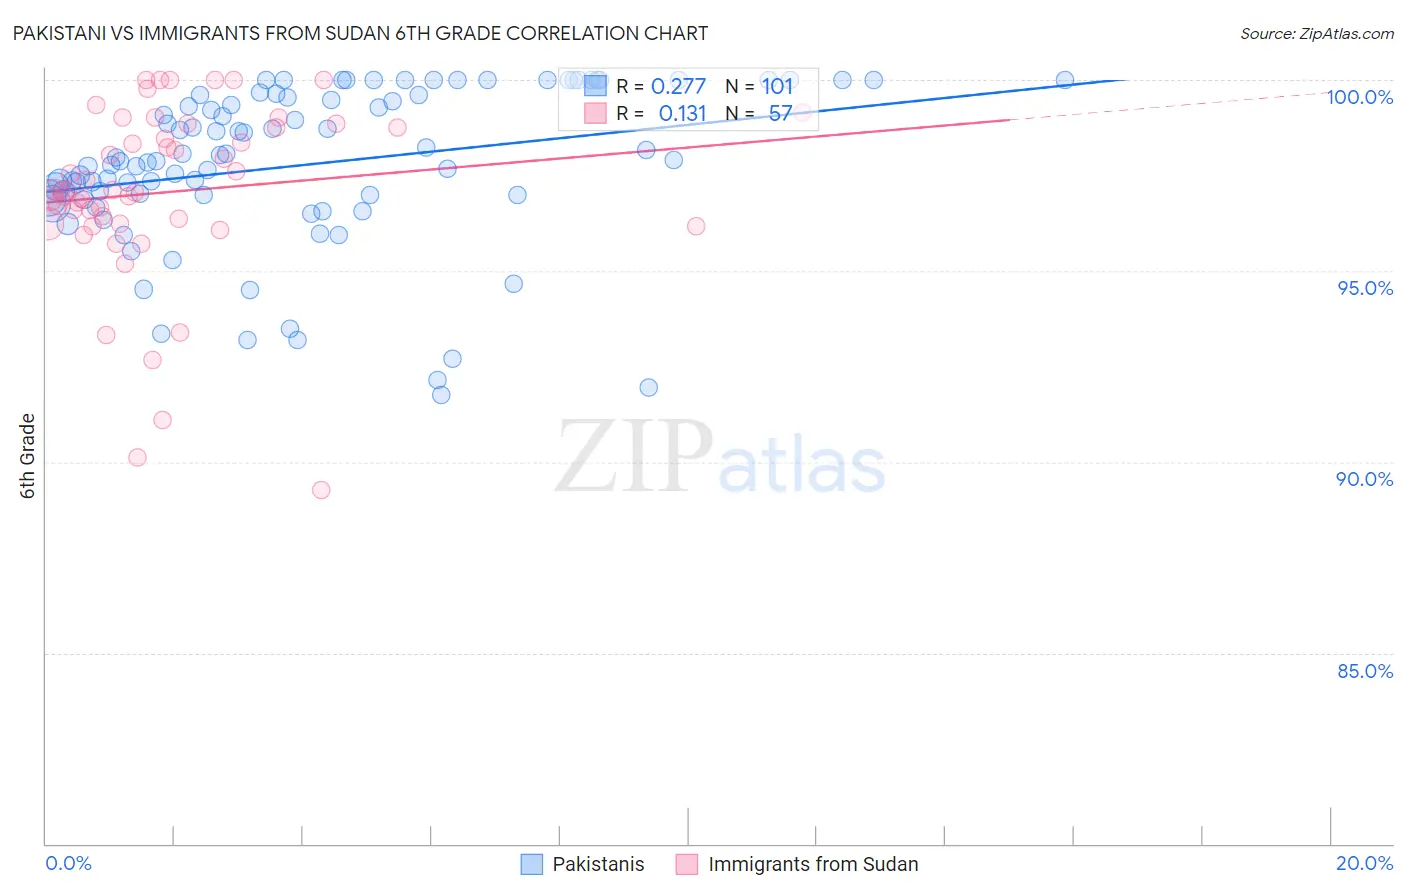
Pakistani vs Immigrants from Sudan 6th Grade Correlation Chart
The statistical analysis conducted on geographies consisting of 335,355,370 people shows a weak positive correlation between the proportion of Pakistanis and percentage of population with at least 6th grade education in the United States with a correlation coefficient (R) of 0.277 and weighted average of 97.0%. Similarly, the statistical analysis conducted on geographies consisting of 118,959,807 people shows a poor positive correlation between the proportion of Immigrants from Sudan and percentage of population with at least 6th grade education in the United States with a correlation coefficient (R) of 0.131 and weighted average of 96.8%, a difference of 0.25%.
6th Grade Correlation Summary
| Measurement | Pakistani | Immigrants from Sudan |
| Minimum | 91.8% | 89.3% |
| Maximum | 100.0% | 100.0% |
| Range | 8.2% | 10.7% |
| Mean | 97.8% | 97.1% |
| Median | 97.9% | 97.1% |
| Interquartile 25% (IQ1) | 96.9% | 96.2% |
| Interquartile 75% (IQ3) | 99.6% | 98.8% |
| Interquartile Range (IQR) | 2.7% | 2.6% |
| Standard Deviation (Sample) | 2.1% | 2.3% |
| Standard Deviation (Population) | 2.1% | 2.3% |
Similar Demographics by 6th Grade
Demographics Similar to Pakistanis by 6th Grade
In terms of 6th grade, the demographic groups most similar to Pakistanis are Mongolian (97.0%, a difference of 0.0%), Immigrants from Kenya (97.0%, a difference of 0.0%), Immigrants from Kazakhstan (97.0%, a difference of 0.010%), Immigrants from Micronesia (97.0%, a difference of 0.010%), and Egyptian (97.1%, a difference of 0.020%).
| Demographics | Rating | Rank | 6th Grade |
| Immigrants | Sri Lanka | 51.7 /100 | #171 | Average 97.1% |
| Egyptians | 50.9 /100 | #172 | Average 97.1% |
| Arabs | 50.1 /100 | #173 | Average 97.0% |
| Venezuelans | 50.0 /100 | #174 | Average 97.0% |
| Immigrants | Kazakhstan | 47.3 /100 | #175 | Average 97.0% |
| Immigrants | Micronesia | 47.1 /100 | #176 | Average 97.0% |
| Mongolians | 46.7 /100 | #177 | Average 97.0% |
| Pakistanis | 46.0 /100 | #178 | Average 97.0% |
| Immigrants | Kenya | 45.3 /100 | #179 | Average 97.0% |
| Immigrants | Spain | 39.9 /100 | #180 | Fair 97.0% |
| Comanche | 37.9 /100 | #181 | Fair 97.0% |
| Immigrants | Ukraine | 35.6 /100 | #182 | Fair 97.0% |
| Immigrants | Venezuela | 34.5 /100 | #183 | Fair 97.0% |
| Spanish Americans | 33.5 /100 | #184 | Fair 97.0% |
| Argentineans | 33.0 /100 | #185 | Fair 97.0% |
Demographics Similar to Immigrants from Sudan by 6th Grade
In terms of 6th grade, the demographic groups most similar to Immigrants from Sudan are Moroccan (96.8%, a difference of 0.0%), Immigrants from Iraq (96.8%, a difference of 0.010%), Portuguese (96.8%, a difference of 0.010%), Sierra Leonean (96.8%, a difference of 0.010%), and Paiute (96.8%, a difference of 0.010%).
| Demographics | Rating | Rank | 6th Grade |
| Laotians | 11.8 /100 | #206 | Poor 96.8% |
| Iraqis | 11.7 /100 | #207 | Poor 96.8% |
| Samoans | 11.0 /100 | #208 | Poor 96.8% |
| Immigrants | Oceania | 11.0 /100 | #209 | Poor 96.8% |
| Immigrants | Nepal | 10.1 /100 | #210 | Poor 96.8% |
| Immigrants | Iraq | 9.2 /100 | #211 | Tragic 96.8% |
| Moroccans | 9.0 /100 | #212 | Tragic 96.8% |
| Immigrants | Sudan | 8.7 /100 | #213 | Tragic 96.8% |
| Portuguese | 8.2 /100 | #214 | Tragic 96.8% |
| Sierra Leoneans | 8.0 /100 | #215 | Tragic 96.8% |
| Paiute | 7.8 /100 | #216 | Tragic 96.8% |
| Liberians | 7.5 /100 | #217 | Tragic 96.8% |
| Navajo | 7.3 /100 | #218 | Tragic 96.8% |
| Costa Ricans | 6.8 /100 | #219 | Tragic 96.8% |
| Immigrants | Morocco | 6.2 /100 | #220 | Tragic 96.7% |