Arapaho vs Immigrants from Sudan 6th Grade
COMPARE
Arapaho
Immigrants from Sudan
6th Grade
6th Grade Comparison
Arapaho
Immigrants from Sudan
97.8%
6TH GRADE
99.9/ 100
METRIC RATING
46th/ 347
METRIC RANK
96.8%
6TH GRADE
8.7/ 100
METRIC RATING
213th/ 347
METRIC RANK
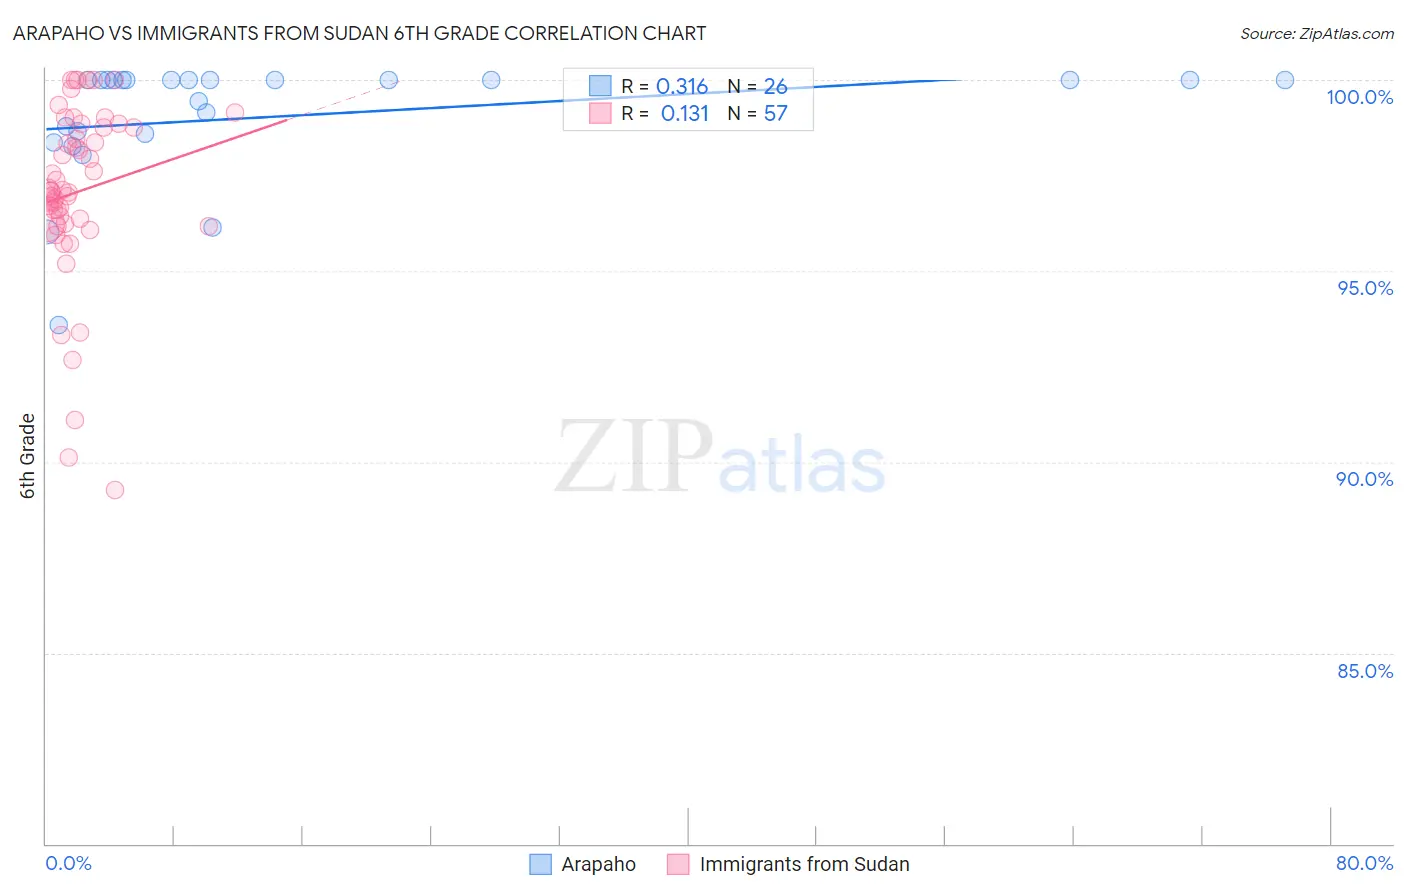
Arapaho vs Immigrants from Sudan 6th Grade Correlation Chart
The statistical analysis conducted on geographies consisting of 29,780,295 people shows a mild positive correlation between the proportion of Arapaho and percentage of population with at least 6th grade education in the United States with a correlation coefficient (R) of 0.316 and weighted average of 97.8%. Similarly, the statistical analysis conducted on geographies consisting of 118,959,807 people shows a poor positive correlation between the proportion of Immigrants from Sudan and percentage of population with at least 6th grade education in the United States with a correlation coefficient (R) of 0.131 and weighted average of 96.8%, a difference of 1.0%.
6th Grade Correlation Summary
| Measurement | Arapaho | Immigrants from Sudan |
| Minimum | 93.6% | 89.3% |
| Maximum | 100.0% | 100.0% |
| Range | 6.4% | 10.7% |
| Mean | 99.0% | 97.1% |
| Median | 100.0% | 97.1% |
| Interquartile 25% (IQ1) | 98.6% | 96.2% |
| Interquartile 75% (IQ3) | 100.0% | 98.8% |
| Interquartile Range (IQR) | 1.4% | 2.6% |
| Standard Deviation (Sample) | 1.6% | 2.3% |
| Standard Deviation (Population) | 1.6% | 2.3% |
Similar Demographics by 6th Grade
Demographics Similar to Arapaho by 6th Grade
In terms of 6th grade, the demographic groups most similar to Arapaho are Bulgarian (97.8%, a difference of 0.010%), Native Hawaiian (97.8%, a difference of 0.010%), Celtic (97.8%, a difference of 0.010%), Estonian (97.8%, a difference of 0.010%), and Immigrants from Scotland (97.8%, a difference of 0.010%).
| Demographics | Rating | Rank | 6th Grade |
| Luxembourgers | 99.9 /100 | #39 | Exceptional 97.9% |
| Latvians | 99.9 /100 | #40 | Exceptional 97.9% |
| Eastern Europeans | 99.9 /100 | #41 | Exceptional 97.9% |
| Hungarians | 99.9 /100 | #42 | Exceptional 97.8% |
| Northern Europeans | 99.9 /100 | #43 | Exceptional 97.8% |
| Czechoslovakians | 99.9 /100 | #44 | Exceptional 97.8% |
| Bulgarians | 99.9 /100 | #45 | Exceptional 97.8% |
| Arapaho | 99.9 /100 | #46 | Exceptional 97.8% |
| Native Hawaiians | 99.9 /100 | #47 | Exceptional 97.8% |
| Celtics | 99.9 /100 | #48 | Exceptional 97.8% |
| Estonians | 99.8 /100 | #49 | Exceptional 97.8% |
| Immigrants | Scotland | 99.8 /100 | #50 | Exceptional 97.8% |
| Maltese | 99.8 /100 | #51 | Exceptional 97.8% |
| Australians | 99.8 /100 | #52 | Exceptional 97.8% |
| Slavs | 99.8 /100 | #53 | Exceptional 97.8% |
Demographics Similar to Immigrants from Sudan by 6th Grade
In terms of 6th grade, the demographic groups most similar to Immigrants from Sudan are Moroccan (96.8%, a difference of 0.0%), Immigrants from Iraq (96.8%, a difference of 0.010%), Portuguese (96.8%, a difference of 0.010%), Sierra Leonean (96.8%, a difference of 0.010%), and Paiute (96.8%, a difference of 0.010%).
| Demographics | Rating | Rank | 6th Grade |
| Laotians | 11.8 /100 | #206 | Poor 96.8% |
| Iraqis | 11.7 /100 | #207 | Poor 96.8% |
| Samoans | 11.0 /100 | #208 | Poor 96.8% |
| Immigrants | Oceania | 11.0 /100 | #209 | Poor 96.8% |
| Immigrants | Nepal | 10.1 /100 | #210 | Poor 96.8% |
| Immigrants | Iraq | 9.2 /100 | #211 | Tragic 96.8% |
| Moroccans | 9.0 /100 | #212 | Tragic 96.8% |
| Immigrants | Sudan | 8.7 /100 | #213 | Tragic 96.8% |
| Portuguese | 8.2 /100 | #214 | Tragic 96.8% |
| Sierra Leoneans | 8.0 /100 | #215 | Tragic 96.8% |
| Paiute | 7.8 /100 | #216 | Tragic 96.8% |
| Liberians | 7.5 /100 | #217 | Tragic 96.8% |
| Navajo | 7.3 /100 | #218 | Tragic 96.8% |
| Costa Ricans | 6.8 /100 | #219 | Tragic 96.8% |
| Immigrants | Morocco | 6.2 /100 | #220 | Tragic 96.7% |