Haitian vs Immigrants from Sudan 6th Grade
COMPARE
Haitian
Immigrants from Sudan
6th Grade
6th Grade Comparison
Haitians
Immigrants from Sudan
95.8%
6TH GRADE
0.0/ 100
METRIC RATING
297th/ 347
METRIC RANK
96.8%
6TH GRADE
8.7/ 100
METRIC RATING
213th/ 347
METRIC RANK
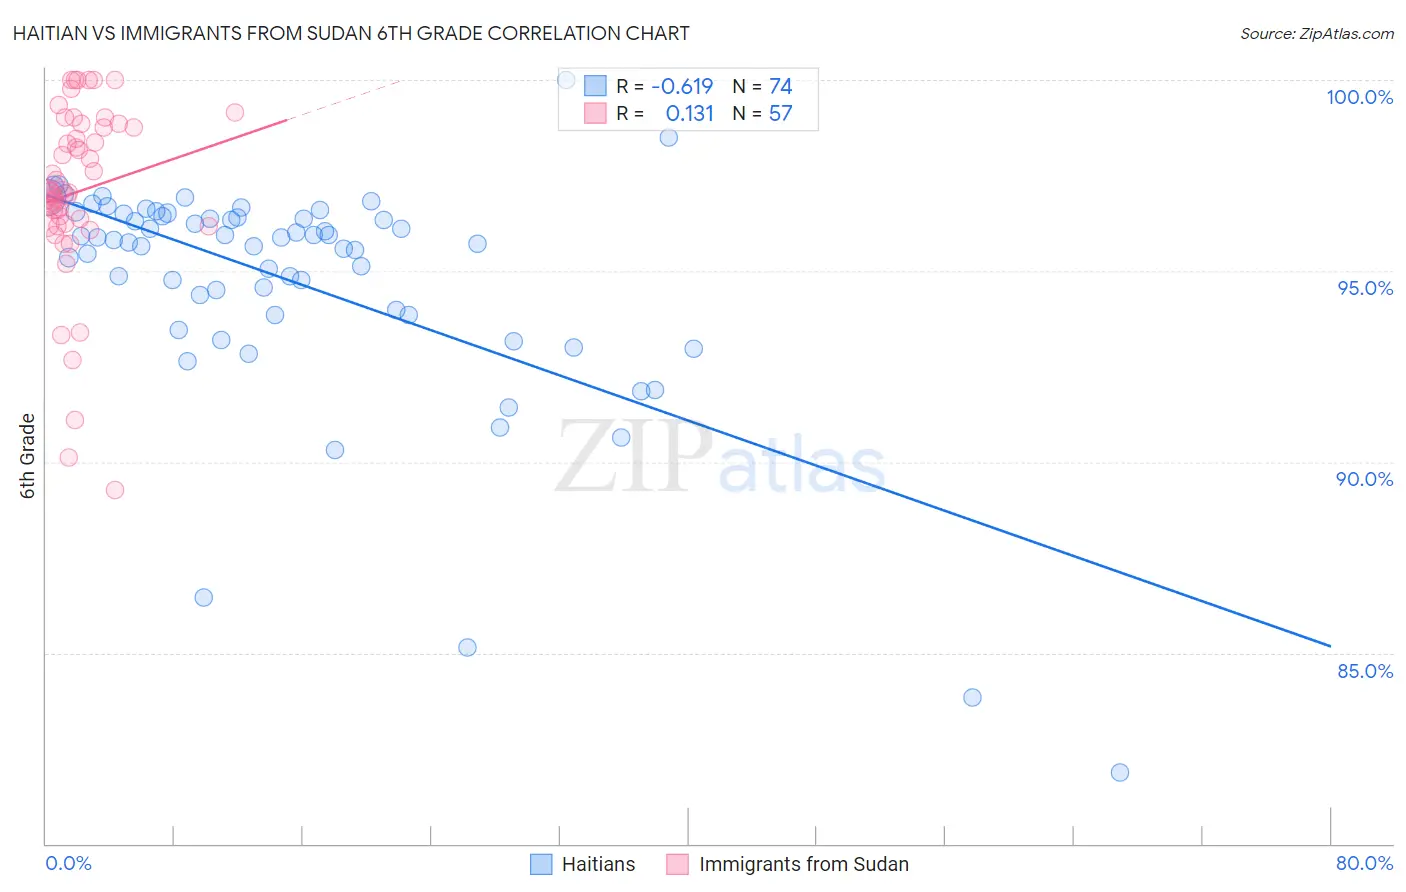
Haitian vs Immigrants from Sudan 6th Grade Correlation Chart
The statistical analysis conducted on geographies consisting of 288,018,742 people shows a significant negative correlation between the proportion of Haitians and percentage of population with at least 6th grade education in the United States with a correlation coefficient (R) of -0.619 and weighted average of 95.8%. Similarly, the statistical analysis conducted on geographies consisting of 118,959,807 people shows a poor positive correlation between the proportion of Immigrants from Sudan and percentage of population with at least 6th grade education in the United States with a correlation coefficient (R) of 0.131 and weighted average of 96.8%, a difference of 1.0%.
6th Grade Correlation Summary
| Measurement | Haitian | Immigrants from Sudan |
| Minimum | 81.9% | 89.3% |
| Maximum | 100.0% | 100.0% |
| Range | 18.1% | 10.7% |
| Mean | 94.7% | 97.1% |
| Median | 95.8% | 97.1% |
| Interquartile 25% (IQ1) | 93.8% | 96.2% |
| Interquartile 75% (IQ3) | 96.4% | 98.8% |
| Interquartile Range (IQR) | 2.6% | 2.6% |
| Standard Deviation (Sample) | 3.1% | 2.3% |
| Standard Deviation (Population) | 3.1% | 2.3% |
Similar Demographics by 6th Grade
Demographics Similar to Haitians by 6th Grade
In terms of 6th grade, the demographic groups most similar to Haitians are Sri Lankan (95.8%, a difference of 0.070%), Immigrants from Laos (95.7%, a difference of 0.080%), Immigrants from Dominica (95.7%, a difference of 0.090%), Immigrants (95.7%, a difference of 0.10%), and Immigrants from South Eastern Asia (95.9%, a difference of 0.11%).
| Demographics | Rating | Rank | 6th Grade |
| Immigrants | Somalia | 0.0 /100 | #290 | Tragic 96.1% |
| Immigrants | St. Vincent and the Grenadines | 0.0 /100 | #291 | Tragic 96.1% |
| Immigrants | Barbados | 0.0 /100 | #292 | Tragic 96.1% |
| Immigrants | West Indies | 0.0 /100 | #293 | Tragic 96.1% |
| British West Indians | 0.0 /100 | #294 | Tragic 96.0% |
| Immigrants | Grenada | 0.0 /100 | #295 | Tragic 95.9% |
| Immigrants | South Eastern Asia | 0.0 /100 | #296 | Tragic 95.9% |
| Haitians | 0.0 /100 | #297 | Tragic 95.8% |
| Sri Lankans | 0.0 /100 | #298 | Tragic 95.8% |
| Immigrants | Laos | 0.0 /100 | #299 | Tragic 95.7% |
| Immigrants | Dominica | 0.0 /100 | #300 | Tragic 95.7% |
| Immigrants | Immigrants | 0.0 /100 | #301 | Tragic 95.7% |
| Immigrants | Burma/Myanmar | 0.0 /100 | #302 | Tragic 95.7% |
| Bangladeshis | 0.0 /100 | #303 | Tragic 95.7% |
| Indonesians | 0.0 /100 | #304 | Tragic 95.6% |
Demographics Similar to Immigrants from Sudan by 6th Grade
In terms of 6th grade, the demographic groups most similar to Immigrants from Sudan are Moroccan (96.8%, a difference of 0.0%), Immigrants from Iraq (96.8%, a difference of 0.010%), Portuguese (96.8%, a difference of 0.010%), Sierra Leonean (96.8%, a difference of 0.010%), and Paiute (96.8%, a difference of 0.010%).
| Demographics | Rating | Rank | 6th Grade |
| Laotians | 11.8 /100 | #206 | Poor 96.8% |
| Iraqis | 11.7 /100 | #207 | Poor 96.8% |
| Samoans | 11.0 /100 | #208 | Poor 96.8% |
| Immigrants | Oceania | 11.0 /100 | #209 | Poor 96.8% |
| Immigrants | Nepal | 10.1 /100 | #210 | Poor 96.8% |
| Immigrants | Iraq | 9.2 /100 | #211 | Tragic 96.8% |
| Moroccans | 9.0 /100 | #212 | Tragic 96.8% |
| Immigrants | Sudan | 8.7 /100 | #213 | Tragic 96.8% |
| Portuguese | 8.2 /100 | #214 | Tragic 96.8% |
| Sierra Leoneans | 8.0 /100 | #215 | Tragic 96.8% |
| Paiute | 7.8 /100 | #216 | Tragic 96.8% |
| Liberians | 7.5 /100 | #217 | Tragic 96.8% |
| Navajo | 7.3 /100 | #218 | Tragic 96.8% |
| Costa Ricans | 6.8 /100 | #219 | Tragic 96.8% |
| Immigrants | Morocco | 6.2 /100 | #220 | Tragic 96.7% |