Soviet Union vs Immigrants from Egypt Doctorate Degree
COMPARE
Soviet Union
Immigrants from Egypt
Doctorate Degree
Doctorate Degree Comparison
Soviet Union
Immigrants from Egypt
2.5%
DOCTORATE DEGREE
100.0/ 100
METRIC RATING
43rd/ 347
METRIC RANK
2.1%
DOCTORATE DEGREE
98.2/ 100
METRIC RATING
99th/ 347
METRIC RANK
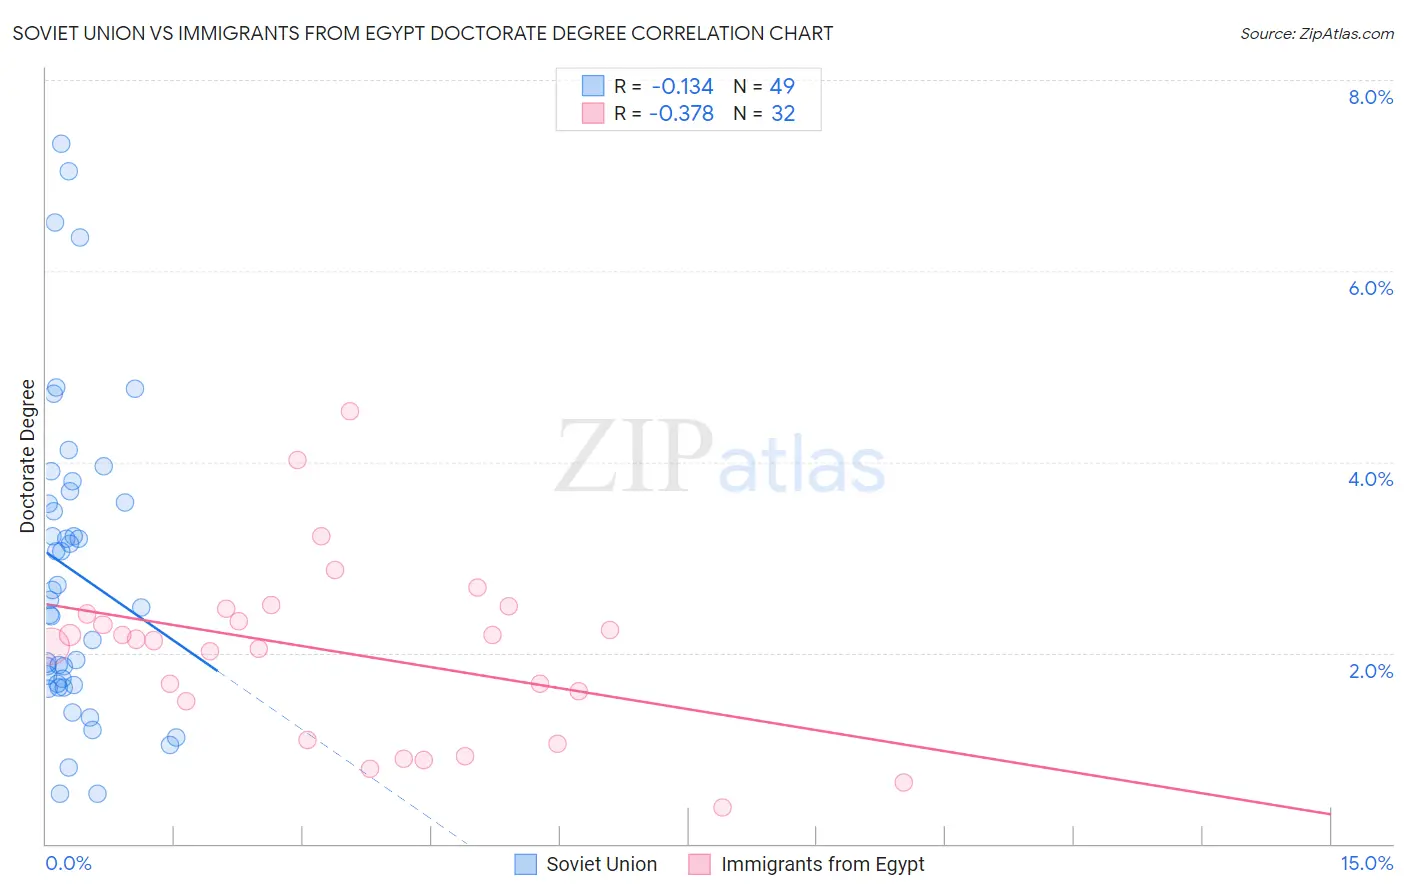
Soviet Union vs Immigrants from Egypt Doctorate Degree Correlation Chart
The statistical analysis conducted on geographies consisting of 43,500,474 people shows a poor negative correlation between the proportion of Soviet Union and percentage of population with at least doctorate degree education in the United States with a correlation coefficient (R) of -0.134 and weighted average of 2.5%. Similarly, the statistical analysis conducted on geographies consisting of 244,806,007 people shows a mild negative correlation between the proportion of Immigrants from Egypt and percentage of population with at least doctorate degree education in the United States with a correlation coefficient (R) of -0.378 and weighted average of 2.1%, a difference of 17.6%.
Doctorate Degree Correlation Summary
| Measurement | Soviet Union | Immigrants from Egypt |
| Minimum | 0.52% | 0.38% |
| Maximum | 7.3% | 4.5% |
| Range | 6.8% | 4.1% |
| Mean | 2.9% | 2.0% |
| Median | 2.5% | 2.1% |
| Interquartile 25% (IQ1) | 1.7% | 1.3% |
| Interquartile 75% (IQ3) | 3.6% | 2.4% |
| Interquartile Range (IQR) | 2.0% | 1.1% |
| Standard Deviation (Sample) | 1.6% | 0.92% |
| Standard Deviation (Population) | 1.6% | 0.91% |
Similar Demographics by Doctorate Degree
Demographics Similar to Soviet Union by Doctorate Degree
In terms of doctorate degree, the demographic groups most similar to Soviet Union are Immigrants from Netherlands (2.5%, a difference of 0.040%), New Zealander (2.5%, a difference of 0.94%), Immigrants from South Africa (2.4%, a difference of 1.5%), Immigrants from Russia (2.5%, a difference of 1.6%), and Immigrants from Austria (2.4%, a difference of 1.7%).
| Demographics | Rating | Rank | Doctorate Degree |
| Immigrants | Spain | 100.0 /100 | #36 | Exceptional 2.6% |
| Immigrants | Kuwait | 100.0 /100 | #37 | Exceptional 2.6% |
| Russians | 100.0 /100 | #38 | Exceptional 2.6% |
| Immigrants | Ireland | 100.0 /100 | #39 | Exceptional 2.5% |
| Estonians | 100.0 /100 | #40 | Exceptional 2.5% |
| Immigrants | Russia | 100.0 /100 | #41 | Exceptional 2.5% |
| New Zealanders | 100.0 /100 | #42 | Exceptional 2.5% |
| Soviet Union | 100.0 /100 | #43 | Exceptional 2.5% |
| Immigrants | Netherlands | 100.0 /100 | #44 | Exceptional 2.5% |
| Immigrants | South Africa | 100.0 /100 | #45 | Exceptional 2.4% |
| Immigrants | Austria | 100.0 /100 | #46 | Exceptional 2.4% |
| Immigrants | Western Europe | 100.0 /100 | #47 | Exceptional 2.4% |
| Asians | 100.0 /100 | #48 | Exceptional 2.4% |
| Immigrants | Asia | 100.0 /100 | #49 | Exceptional 2.4% |
| Immigrants | Norway | 100.0 /100 | #50 | Exceptional 2.4% |
Demographics Similar to Immigrants from Egypt by Doctorate Degree
In terms of doctorate degree, the demographic groups most similar to Immigrants from Egypt are Immigrants from Eastern Europe (2.1%, a difference of 0.0%), Immigrants from Eastern Africa (2.1%, a difference of 0.030%), Armenian (2.1%, a difference of 0.18%), Immigrants from Chile (2.1%, a difference of 0.25%), and Immigrants from Eritrea (2.1%, a difference of 0.26%).
| Demographics | Rating | Rank | Doctorate Degree |
| Chileans | 99.1 /100 | #92 | Exceptional 2.2% |
| Alsatians | 99.0 /100 | #93 | Exceptional 2.1% |
| Greeks | 98.8 /100 | #94 | Exceptional 2.1% |
| Immigrants | Romania | 98.7 /100 | #95 | Exceptional 2.1% |
| Immigrants | Northern Africa | 98.4 /100 | #96 | Exceptional 2.1% |
| Immigrants | Eritrea | 98.4 /100 | #97 | Exceptional 2.1% |
| Armenians | 98.3 /100 | #98 | Exceptional 2.1% |
| Immigrants | Egypt | 98.2 /100 | #99 | Exceptional 2.1% |
| Immigrants | Eastern Europe | 98.2 /100 | #100 | Exceptional 2.1% |
| Immigrants | Eastern Africa | 98.2 /100 | #101 | Exceptional 2.1% |
| Immigrants | Chile | 98.1 /100 | #102 | Exceptional 2.1% |
| Romanians | 98.1 /100 | #103 | Exceptional 2.1% |
| Austrians | 98.0 /100 | #104 | Exceptional 2.1% |
| Arabs | 97.8 /100 | #105 | Exceptional 2.1% |
| Sudanese | 97.7 /100 | #106 | Exceptional 2.1% |