Malaysian vs Cypriot Professional Degree
COMPARE
Malaysian
Cypriot
Professional Degree
Professional Degree Comparison
Malaysians
Cypriots
3.4%
PROFESSIONAL DEGREE
0.2/ 100
METRIC RATING
302nd/ 347
METRIC RANK
6.9%
PROFESSIONAL DEGREE
100.0/ 100
METRIC RATING
11th/ 347
METRIC RANK
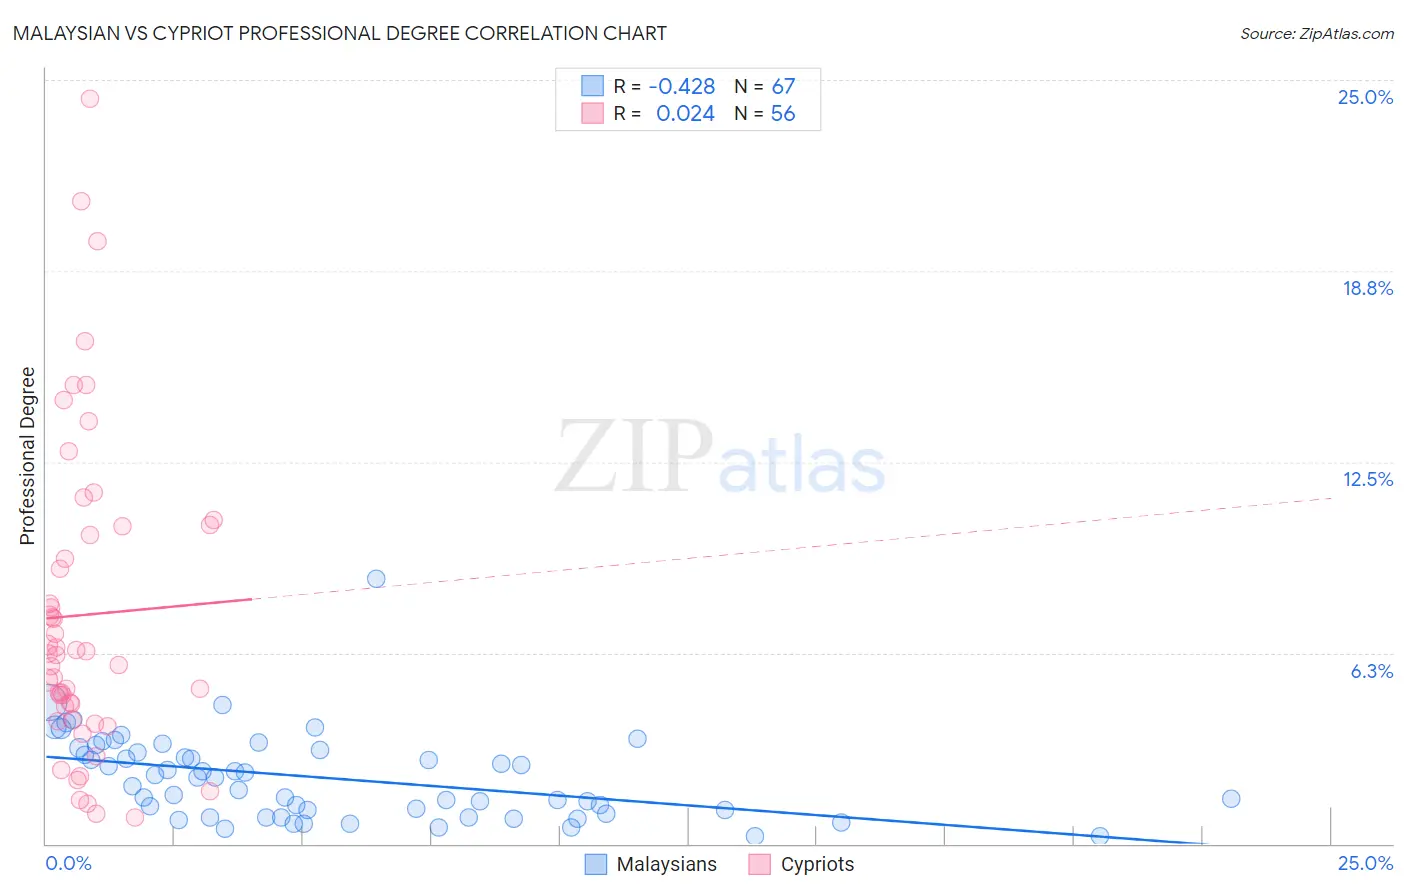
Malaysian vs Cypriot Professional Degree Correlation Chart
The statistical analysis conducted on geographies consisting of 225,764,269 people shows a moderate negative correlation between the proportion of Malaysians and percentage of population with at least professional degree education in the United States with a correlation coefficient (R) of -0.428 and weighted average of 3.4%. Similarly, the statistical analysis conducted on geographies consisting of 61,833,042 people shows no correlation between the proportion of Cypriots and percentage of population with at least professional degree education in the United States with a correlation coefficient (R) of 0.024 and weighted average of 6.9%, a difference of 104.4%.
Professional Degree Correlation Summary
| Measurement | Malaysian | Cypriot |
| Minimum | 0.26% | 0.85% |
| Maximum | 8.7% | 24.4% |
| Range | 8.4% | 23.5% |
| Mean | 2.2% | 7.5% |
| Median | 2.1% | 6.2% |
| Interquartile 25% (IQ1) | 0.97% | 4.3% |
| Interquartile 75% (IQ3) | 3.1% | 10.2% |
| Interquartile Range (IQR) | 2.1% | 6.0% |
| Standard Deviation (Sample) | 1.4% | 5.1% |
| Standard Deviation (Population) | 1.4% | 5.1% |
Similar Demographics by Professional Degree
Demographics Similar to Malaysians by Professional Degree
In terms of professional degree, the demographic groups most similar to Malaysians are Immigrants from Dominican Republic (3.4%, a difference of 0.11%), Black/African American (3.4%, a difference of 0.25%), Immigrants from Yemen (3.4%, a difference of 0.38%), Immigrants from Haiti (3.4%, a difference of 0.66%), and Cajun (3.4%, a difference of 0.66%).
| Demographics | Rating | Rank | Professional Degree |
| Immigrants | Guatemala | 0.2 /100 | #295 | Tragic 3.4% |
| Hawaiians | 0.2 /100 | #296 | Tragic 3.4% |
| Immigrants | Liberia | 0.2 /100 | #297 | Tragic 3.4% |
| Ottawa | 0.2 /100 | #298 | Tragic 3.4% |
| Immigrants | Yemen | 0.2 /100 | #299 | Tragic 3.4% |
| Blacks/African Americans | 0.2 /100 | #300 | Tragic 3.4% |
| Immigrants | Dominican Republic | 0.2 /100 | #301 | Tragic 3.4% |
| Malaysians | 0.2 /100 | #302 | Tragic 3.4% |
| Immigrants | Haiti | 0.2 /100 | #303 | Tragic 3.4% |
| Cajuns | 0.2 /100 | #304 | Tragic 3.4% |
| Chickasaw | 0.1 /100 | #305 | Tragic 3.4% |
| Cape Verdeans | 0.1 /100 | #306 | Tragic 3.4% |
| Samoans | 0.1 /100 | #307 | Tragic 3.3% |
| Shoshone | 0.1 /100 | #308 | Tragic 3.3% |
| Pima | 0.1 /100 | #309 | Tragic 3.3% |
Demographics Similar to Cypriots by Professional Degree
In terms of professional degree, the demographic groups most similar to Cypriots are Israeli (6.9%, a difference of 0.070%), Immigrants from Belgium (7.0%, a difference of 0.17%), Immigrants from Australia (6.9%, a difference of 0.49%), Immigrants from Taiwan (7.1%, a difference of 1.9%), and Immigrants from France (6.8%, a difference of 2.0%).
| Demographics | Rating | Rank | Professional Degree |
| Filipinos | 100.0 /100 | #4 | Exceptional 7.6% |
| Immigrants | Iran | 100.0 /100 | #5 | Exceptional 7.3% |
| Okinawans | 100.0 /100 | #6 | Exceptional 7.3% |
| Eastern Europeans | 100.0 /100 | #7 | Exceptional 7.1% |
| Immigrants | Switzerland | 100.0 /100 | #8 | Exceptional 7.1% |
| Immigrants | Taiwan | 100.0 /100 | #9 | Exceptional 7.1% |
| Immigrants | Belgium | 100.0 /100 | #10 | Exceptional 7.0% |
| Cypriots | 100.0 /100 | #11 | Exceptional 6.9% |
| Israelis | 100.0 /100 | #12 | Exceptional 6.9% |
| Immigrants | Australia | 100.0 /100 | #13 | Exceptional 6.9% |
| Immigrants | France | 100.0 /100 | #14 | Exceptional 6.8% |
| Immigrants | China | 100.0 /100 | #15 | Exceptional 6.7% |
| Immigrants | Sweden | 100.0 /100 | #16 | Exceptional 6.7% |
| Immigrants | Eastern Asia | 100.0 /100 | #17 | Exceptional 6.6% |
| Soviet Union | 100.0 /100 | #18 | Exceptional 6.6% |