Malaysian vs German Russian Professional Degree
COMPARE
Malaysian
German Russian
Professional Degree
Professional Degree Comparison
Malaysians
German Russians
3.4%
PROFESSIONAL DEGREE
0.2/ 100
METRIC RATING
302nd/ 347
METRIC RANK
4.0%
PROFESSIONAL DEGREE
6.1/ 100
METRIC RATING
226th/ 347
METRIC RANK
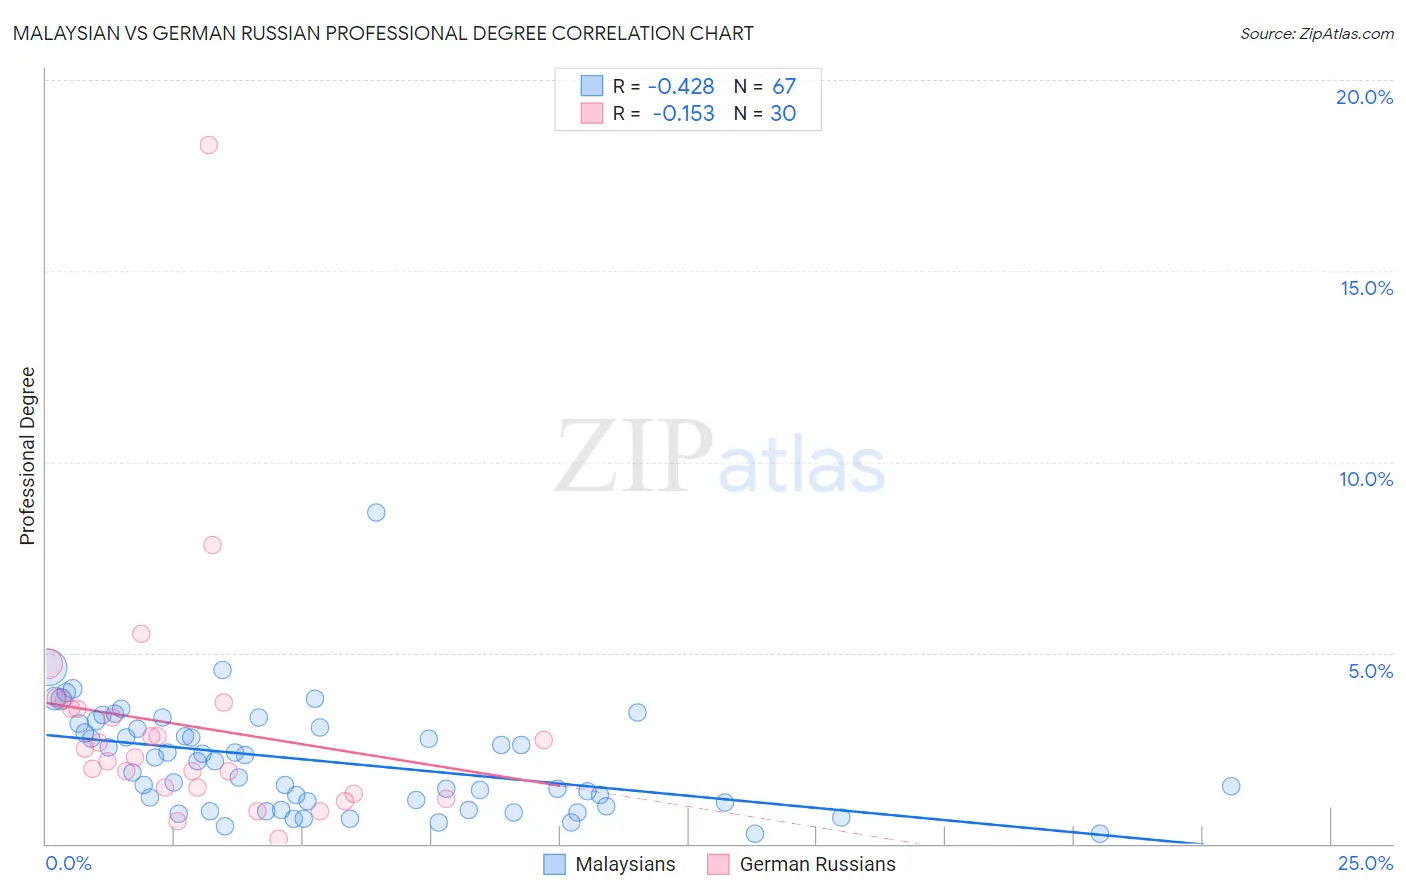
Malaysian vs German Russian Professional Degree Correlation Chart
The statistical analysis conducted on geographies consisting of 225,764,269 people shows a moderate negative correlation between the proportion of Malaysians and percentage of population with at least professional degree education in the United States with a correlation coefficient (R) of -0.428 and weighted average of 3.4%. Similarly, the statistical analysis conducted on geographies consisting of 96,360,992 people shows a poor negative correlation between the proportion of German Russians and percentage of population with at least professional degree education in the United States with a correlation coefficient (R) of -0.153 and weighted average of 4.0%, a difference of 16.9%.
Professional Degree Correlation Summary
| Measurement | Malaysian | German Russian |
| Minimum | 0.26% | 0.15% |
| Maximum | 8.7% | 18.3% |
| Range | 8.4% | 18.2% |
| Mean | 2.2% | 3.1% |
| Median | 2.1% | 2.4% |
| Interquartile 25% (IQ1) | 0.97% | 1.5% |
| Interquartile 75% (IQ3) | 3.1% | 3.6% |
| Interquartile Range (IQR) | 2.1% | 2.1% |
| Standard Deviation (Sample) | 1.4% | 3.3% |
| Standard Deviation (Population) | 1.4% | 3.2% |
Similar Demographics by Professional Degree
Demographics Similar to Malaysians by Professional Degree
In terms of professional degree, the demographic groups most similar to Malaysians are Immigrants from Dominican Republic (3.4%, a difference of 0.11%), Black/African American (3.4%, a difference of 0.25%), Immigrants from Yemen (3.4%, a difference of 0.38%), Immigrants from Haiti (3.4%, a difference of 0.66%), and Cajun (3.4%, a difference of 0.66%).
| Demographics | Rating | Rank | Professional Degree |
| Immigrants | Guatemala | 0.2 /100 | #295 | Tragic 3.4% |
| Hawaiians | 0.2 /100 | #296 | Tragic 3.4% |
| Immigrants | Liberia | 0.2 /100 | #297 | Tragic 3.4% |
| Ottawa | 0.2 /100 | #298 | Tragic 3.4% |
| Immigrants | Yemen | 0.2 /100 | #299 | Tragic 3.4% |
| Blacks/African Americans | 0.2 /100 | #300 | Tragic 3.4% |
| Immigrants | Dominican Republic | 0.2 /100 | #301 | Tragic 3.4% |
| Malaysians | 0.2 /100 | #302 | Tragic 3.4% |
| Immigrants | Haiti | 0.2 /100 | #303 | Tragic 3.4% |
| Cajuns | 0.2 /100 | #304 | Tragic 3.4% |
| Chickasaw | 0.1 /100 | #305 | Tragic 3.4% |
| Cape Verdeans | 0.1 /100 | #306 | Tragic 3.4% |
| Samoans | 0.1 /100 | #307 | Tragic 3.3% |
| Shoshone | 0.1 /100 | #308 | Tragic 3.3% |
| Pima | 0.1 /100 | #309 | Tragic 3.3% |
Demographics Similar to German Russians by Professional Degree
In terms of professional degree, the demographic groups most similar to German Russians are Cuban (4.0%, a difference of 0.12%), Immigrants from West Indies (4.0%, a difference of 0.37%), Immigrants from Burma/Myanmar (3.9%, a difference of 0.52%), Tlingit-Haida (4.0%, a difference of 0.55%), and Trinidadian and Tobagonian (4.0%, a difference of 0.68%).
| Demographics | Rating | Rank | Professional Degree |
| Immigrants | South Eastern Asia | 8.9 /100 | #219 | Tragic 4.0% |
| Ute | 8.2 /100 | #220 | Tragic 4.0% |
| French Canadians | 8.0 /100 | #221 | Tragic 4.0% |
| Immigrants | Western Africa | 7.5 /100 | #222 | Tragic 4.0% |
| Immigrants | Bosnia and Herzegovina | 7.4 /100 | #223 | Tragic 4.0% |
| Trinidadians and Tobagonians | 7.1 /100 | #224 | Tragic 4.0% |
| Tlingit-Haida | 6.9 /100 | #225 | Tragic 4.0% |
| German Russians | 6.1 /100 | #226 | Tragic 4.0% |
| Cubans | 5.9 /100 | #227 | Tragic 4.0% |
| Immigrants | West Indies | 5.6 /100 | #228 | Tragic 4.0% |
| Immigrants | Burma/Myanmar | 5.4 /100 | #229 | Tragic 3.9% |
| Nicaraguans | 5.1 /100 | #230 | Tragic 3.9% |
| Ecuadorians | 4.6 /100 | #231 | Tragic 3.9% |
| Cree | 4.3 /100 | #232 | Tragic 3.9% |
| Immigrants | Philippines | 4.1 /100 | #233 | Tragic 3.9% |